Estimation of liquid carrying vehicles in USA
Contents
Executive Summary
- Industry: The research report analyzes the transportation industry and is targeted at truck rebuilders, manufactures of spare parts, chassis, etc
- Mathematical Mode: This research uses modeling to calculate the total number of the trucks
- Scope: The research focuses on the US market
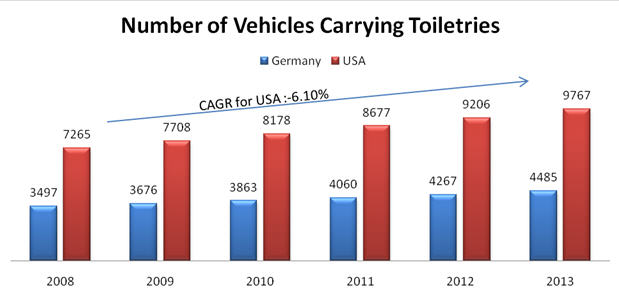
- Result: By the end of the year 2013 total number of trucks carrying liquid toiletries would be 9767 having a CAGR growth of 6.10%.
*Note: The numbers provided in this report are dummy numbers and only serve to explain the methodology followed
Methodology
Objective
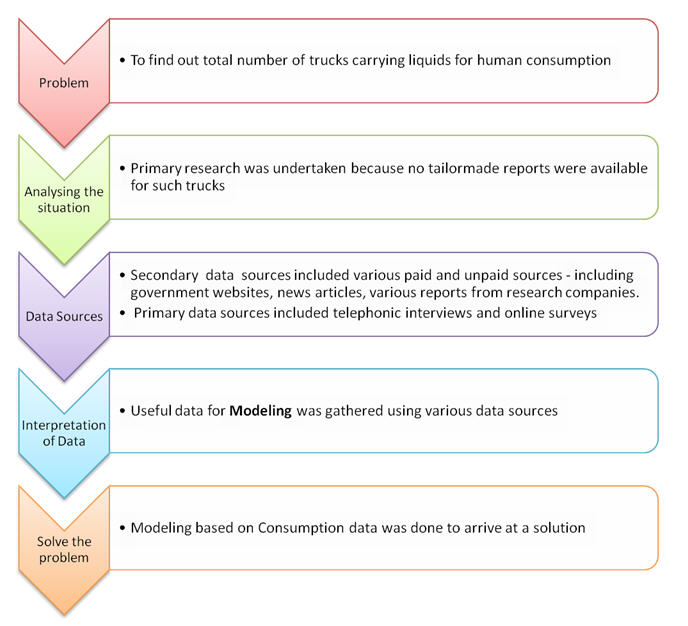
- The research focuses on the estimation of total number of trucks carrying the toiletries.
Situation Analysis
- Truck rebuilders, manufactures of spare parts, chassis, etc. and other service providers in the industry tend to misjudge the market size due to lack of information.
- This research would help aforementioned market players and companies in this industry to get information about the tank trucks carrying toiletries within USA.
- Due to unavailability of secondary data, primary research was undertaken to assimilate the relevant data for the research.
Data Sources-truck
Secondary Data Sources: Secondary sources of information used were Euromonitor International, Marketresearch.com, Datamonitor, Official website of Eurostat, Official website of Federal government of Germany, USCENSUS data, Official website of Department of Statistics –UK, National Statistics Department of UK, Factiva, Wikipedia, Various online published reports.
Primary Data Sources: Primary data sources included telephonic interviews with truck manufacturers, trailer body builders, transportation companies and government officials from various countries.
Challenges
- There is no tailor-made data available for number of trucks/trailers carrying the liquid for human consumption.
- The trucks used for transporting liquids are essentially tank trucks and the transport agencies do not necessarily register them with the transport department.
Interpretation of Data
- Various reports and some useful data were collected from the secondary sources.
- Data pertaining to consumption habits of the consumers was available from Euromonitor. This data was further used for Modeling.
- Primary research provided useful information over the trucks carrying toiletries in Germany which was further used for Modeling. Data was also available from other countries but Germany provided the perfect basis to do Modeling in order to generate data for USA.
Solution
Modeling was done to find the number of trucks within USA that carry toiletries based on the data available for Germany.
Calculating Market Size:
Model country used: GERMANY
Reason for choosing GERMANY as a model country:
- Availability of data for vehicles carrying liquid commodity in Germany.
- For Germany data is gathered from the government data sources.
- Germany, a developed country could be used as a proxy state since data from Germany would approximately mimic the industry structure in the US.
Modeling:
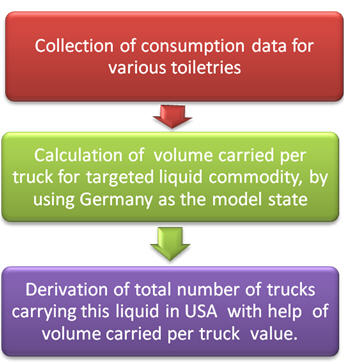
Modeling was done on the basis of the consumption data available for liquid toiletries.
Toiletries
The total volume of toiletries was obtained from Euromonitor.
The number of trucks carrying this commodity is calculated as below:
| Total Volume | 81,595 ,000 Liters |
| Total Trucks | 3497 |
| Therefore, average liquid per vehicle | 23333 liters/truck |
The total number of trucks in USA was derived using the average liquid per vehicle calculated above.
For Example
| Total Volume | 169481Liters |
| Average liquid per vehicle | 23333 liters/truck |
| Total trucks carrying toiletries in USA in 2008 |
7265 |
Results
Forecast for number of vehicles carrying toiletries in USA is done using the straight line method based on the consumption data.


