Diabetes products and services
Diabetes Overview
News stories
- One of the top stories on Reddit - Dec 26, 2006
- Home page story on New York Times - Dec 26, 2006
- "Today nearly one out of every 10 adults in the US has diabetes. Among people over 60, that figure is even higher - one in five. But what's most alarming is that many people don't know they have diabetes until they develop one of its terrible complications - like heart disease, blindness or stroke.": University of California, San Francisco Diabetes Center
Total Prevalence of Diabetes & Pre-diabetes (US)
- Total: 20.8 million children and adults -- 7.0% of the population -- have diabetes.
- Diagnosed: 14.6 million people
- Undiagnosed: 6.2 million people
- Pre-diabetes: 54 million people
- 1.5 million new cases of diabetes were diagnosed in people aged 20 years or older in 2005. (Source)
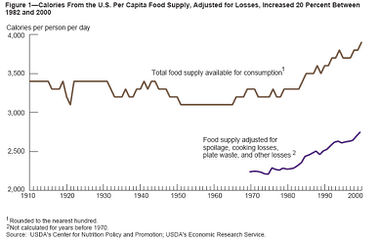
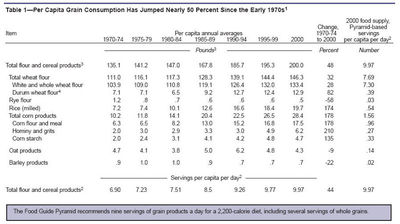
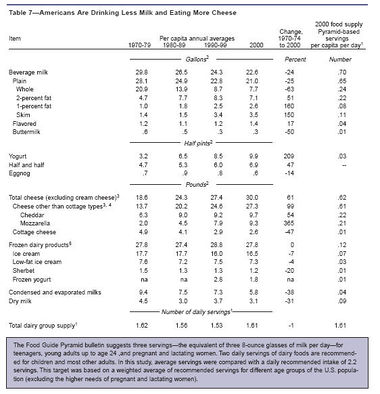
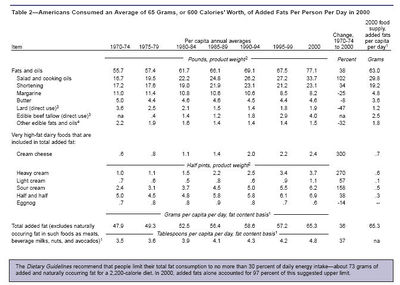
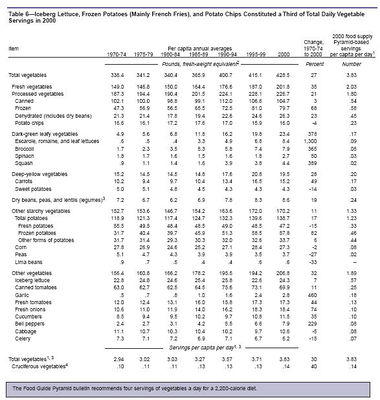
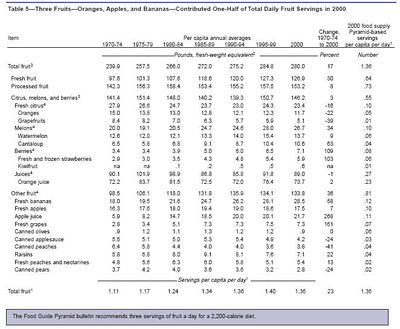
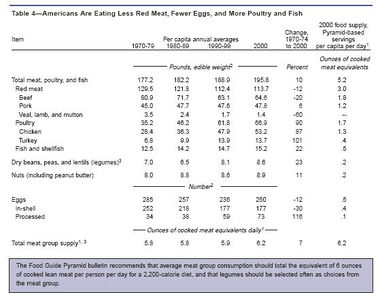
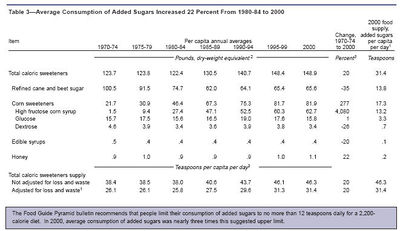
Calories and food consumption - US
- Drinking Coffee Helps Lower the Chance of Getting of Type 2 Diabetes Source
- Coffee and Green Tea May Help Prevent Type 2 Diabetes Source
Maintaining a healthy weight is a challenge for most Americans
- 66.3% of the adult population in the US weigh more than is healthy Where you carry your fat is important. Fat in the mid-section – visceral fat – is worse, as this fat surrounds and invades vital organs. Few Americans add muscle and bone after their early twenties so nearly all added weight is fat
- Daily caloric intake is the number of calories needed per day to maintain your current weight. Maintaining a healthy weight is a balancing act of calories consumed versus calories burned
Weight change = calories in – calories out
- Small increases in daily caloric intake cause increases in body fat mass (Figure 1)
- From 1971-2000 there was a statistically significant increase in average caloric intake—2,450 kcals to 2,618 kcals in men (P < 0.01) and 1,541 kcals to 1,877 kcals in women (P < 0.01) (Figure 2)
- Today, adult men and adult women are almost 25 pounds heavier than 40 years ago (Figure 2). Children aged 6-11 are almost 9 pounds heavier. Teen boys and girls are 15 and 12 pounds heavier respectively, topping the scales in 2002 at 141 pounds and 130 pounds
- Obesity ranks low on the list of serious health problems. Only 9% of respondents to a national survey indicated their own weight was a problem, despite more than 50% were overweight
- As the average daily caloric intake has increased, the percentage of caloric intake from fat decreased, and the percentage from carbohydrates increased significantly for both men and women (Figures 4 and 5)
Dietary habits can help pile on the pounds
- Consumption of food away from home, increased consumption of salty snacks, soft drinks and pizza, and increased portion sizes have contributed to increased caloric intake
- Over the last 20 years portions have grown significantly
- With the exception of white bread, the sizes of marketplace portions exceed federal standards by at least a factor of 2 and sometime 8[
o Items in fast food restaurants are 2 to 5 times larger than 2 decades ago due to the increased variety of available portion sizes

- The increases in portion size are significant and result in more calories consumed. An added 10 kcal/day of unexpended energy is equivalent to an extra pound of weight per year (Figure 6)
Americans need to pay more attention to what we eat and our activity levels
- Recent guidelines from the American Heart Association focus on both a healthy diet and healthy lifestyle to reduce the risk of developing cardiovascular disease
- Recommended calorie intake will differ for individuals based on age, gender, and activity level, as seen in the Dietary Guidelines for Americans 2005, available at: www.healthierus.gov/dietaryguidelines.
- Lifestyle activity levels are directly tied to calorie consumption in the body. Lifestyle activity levels have been defined as:
- Sedentary means a lifestyle that includes only the light physical activity associated with typical day-to-day life
- Moderately active means a lifestyle that includes physical activity (consuming 3.5 to 7 calories/min) equivalent to walking about 1.5 to 3 miles per day at 3 to 4 miles per hour, in addition to the light physical activity associated with typical day-to-day life
- Active means a lifestyle that includes physical activity (consuming > 7 calories/minute) equivalent to walking more than 3 miles per day at 3 to 4 miles per hour, in addition to the light physical activity associated with typical day-to-day life
- The recent Dietary Reference Intakes publication recommends
- Fat intake:
- 30% to 40% kcal in children 1 to 3 years
- 25% to 35% kcal in children 4 to 18 years
- 20% to 35% kcal in adults
- Protein intake:
- 5% to 20% kcal in children 1 to 3 years old
- 10% to 30% kcal in children 4 to 18 years old
- 10% to 35% kcal in adults
- Carbohydrate intake:
- 45% to 65% kcal in all children and adults
- Fat intake:
Diet and exercise can make a difference in your overall health
- Weight reduction requires a careful balance of fat, protein and carbohydrate intake (Figure 7)
- The Nurse’s Health Study and the Health Professionals Follow-up Study demonstrated that middle-aged women and men who gained 11-22 pounds after age 20 were up to 3 times more likely to develop heart disease, high blood pressure, type 2 diabetes, and gallstones than those who gained 5 pounds or fewer
- Weight loss of 5% to 15% of total body weight can lower an individual’s chance of heart disease or having a stroke, as weight loss may improve blood pressure, triglycerides, cholesterol levels, decrease inflammation throughout the body, and improve mental health and quality of life. Moderate intentional weight loss sustained over time may be associated with reduced mortality
- Only 8% of American adults are aware of the link between overweight and cancer.
Overweight leads to insulin resistance and may be linked to breast cancer, aggressive prostate cancer, colorectal cancer and endometrial, kidney, pancreatic and esophagus cancer as well as lymphomas - Higher levels of physical activity promote long-term weight loss better than conventional recommendations for low to moderate activity (Figure 8)
- People who exercise regularly achieve better maintenance of weight loss and have beneficial effects on their cardiovascular, physical and psychological well-being
- Compared to a low-fat diet or conventional weight loss diet, a low-carbohydrate diet program had better participant retention and greater weight loss—there were beneficial effects on serum triglyceride levels and high density lipoprotein as well as improved glycemic control
- Diet and exercise may prevent or delay the onset of diabetes
- Modest weight loss and changes in lifestyle reduced the 3-year incidence of type 2 diabetes by 58%
- Weight loss strategies using dietary, physical activity or behavioral interventions produced significant improvements in weight among person with pre-diabetes, and a significant decrease in diabetes incidence
- Dietary guidelines encourage eating fewer calories, being more active and making wise food choices. Making wise food choices involves a careful look at nutrition labels and calories consumed. Carbohydrates and protein each contain 4 calories/gram while alcohol and fat contain 7 calories and 9 calories per gram, respectively. Don’t waste the daily allotment with empty calories – calories do count
The Universe for Reducing Calories is Expanding
Prevalence of overweight and obese adults is increasing
- Obesity among all ages, races, educational levels, and smoking levels is increasing
- Between 1991 and 2001 prevalence of obesity increased by 74% – 21.4 million obese men and 22.9 million obese women
- During this same time period the percentage of overweight adults increased from 45% to 58%
- In 2004, obese adults represented ≥ 25% of the adult population in 9 of the 50 states (Figure 1)
- In 2003, more than 136,000,000 American adults were overweight, and this number continues to grow
- Recent evidence suggests that increases in body weight in women may be leveling off, though no specific reason for the trend was given
Prevalence of overweight among children has tripled
- Figure 2 shows the change in percent of overweight children, 6-12 and 12-19 years of age, from data analyzed in the mid 1960s and at the turn of the century
- In 2003-2004, 17.1% of children and adolescents 2-19 years of age (over 12.5 million) were overweight
- Prevalence of overweight among girls increased from 13.8% in 1999 to 16.0% in 2004
- Prevalence of overweight among boys increased from 14.0% to 18.2% during the same time frame
- Overweight is associated with a number of comorbidities in children
- Metabolic, orthopedic, cardiovascular, psychological, neurological, hepatic, pulmonary and renal comorbid conditions can exist
Body mass index (BMI), calculated with height and weight, is used to define overweight and obesity
- The NHLBI defines underweight, normal weight, overweight and 3 classes of obesity based on BMI (Table 1)
- BMI = kg/m2 {BMI = weight (pounds) x 703 ÷ height squared (inches)}
- BMI and waist circumference correlate with the amount of body fat; both are surrogate markers of body fat
Table 1. Defining overweight and obesity.
| Classifications of BMI | BMI |
| Underweight | < 18.5 kg/m2 |
| Normal weight | 18.5-24.5 kg/m2 |
| Overweight | 25-29.9 kg/m2 |
| Obesity (Class 1) | 30-30.4 kg/m2 |
| Obesity (Class 2) | 35-39.9 kg/m2 |
| Extreme obesity (Class 3) | > 40 kg/m2 |
Obesity and weight gain are associated with an increased risk of diabetes
- Prevalence of obesity from 1991 to 2001 correlates with the increased prevalence of diabetes (Figure 4)
- Between 1990 and 2001 the prevalence of diabetes increased 61%
- In 2003, 14,100,000 Americans had been diagnosed with diabetes
- More than 80% of type 2 diabetes patients are either overweight or obese
- Diabetic women are at increased risk of major cardiovascular disease and represent the only group where cardiovascular mortality is increasing
There is a progression from normal blood sugar to type 2 diabetes
- Prediabetes is a new term for a condition found in adults before they are diagnosed with diabetes
- Prediabetes is characterized by higher than normal blood glucose levels, either impaired fasting glucose or impaired glucose tolerance not yet high enough to be classified as diabetes
- Almost all diabetic patients go through a phase called impaired glucose tolerance (IGT) or impaired fasting glucose (IFG) (Figure 5)
- Based on projected NHANES III data, the number of prediabetic individuals was almost 12 million in 2000 among overweight individuals (Figure 6)
- • Patients with prediabetes have the potential to develop diabetes within a decade if no modifications to their diet and level of physical activity are made
- Over 50 million adults ages 40-74 have prediabetes, of which 1 in 4 will develop type 2 diabetes
- Prevalence of cardiovascular disease risk factors is high among patients with prediabetes:
- 94.9% had dyslipidemia
- 56.5% had hypertension
- 13.9% had microalbuminuria
- 16.6% were current smokers
- Prediabetes increases a person’s risk for an MI or stroke by 50%
Obesity and diabetes can be prevented
- The 1979 Surgeon General’s Report, Healthy People, laid the foundation for a national prevention agenda to ensure that good health, as well as long life, are enjoyed by all
- The Healthy People 2010 objective is to reduce the prevalence of obesity among adults to < 15%, and to have > 60% of the adult population in the normal weight range
- Another Healthy People 2010 objective is to reduce the number of overweight or obese children and adolescents aged 6-19 years to 5%
- The American Diabetes Association recommends that all overweight people 45 years of age or older with impaired glucose tolerance or impaired fasting glucose should be classified as having prediabetes and that they are potential candidates for diabetes prevention interventions
- The Diabetes Prevention Program (DPP) showed that diet and exercise resulting in a 5 to 7 percent weight loss lowered the incidence of type 2 diabetes by 58%
- Participants lost weight by cutting fat and calories in their diet and by exercising at least 30 minutes per day, 5 days per week
The Essential Elements of Diet Menus for Diabetes
Diet menus for diabetes need to be
- Low
- in fats, particularly saturated or animal fats
- in white, refined flour
- in cholesterol
- in calories, since obesity dramatically increases the risk of heart disease
- in simple or refined sugars
- in sodium, particularly if elevated blood pressure has already been identified
- High
- in complex carbohydrates, particularly those containing raw fiber. For example: brown bread, brown rice
- in fresh fruits and vegetables
Food constituents
Like this report?
This is only a sample report with brief analysis
Dolcera can provide a comprehensive report customized to your needs
Carbohydrates
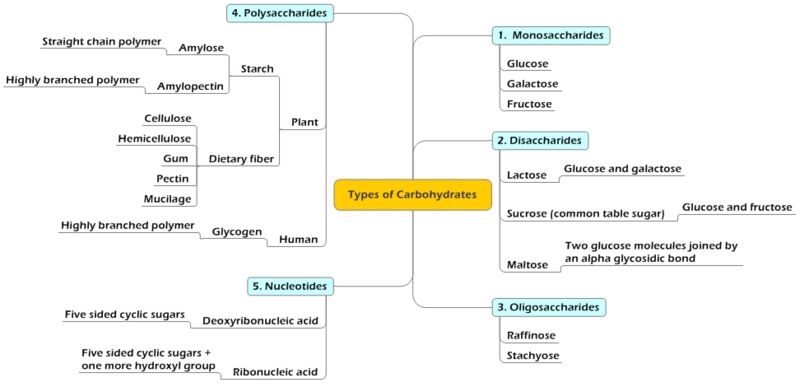
Carbohydrates come from a wide array of foods - bread, beans, milk, popcorn, potatoes, cookies, spaghetti, corn, and cherry pie. The most common and abundant are sugars, fibers, and starches. The basic building block of a carbohydrate is a sugar molecule, a simple union of carbon, hydrogen, and oxygen. Starches and fibers are essentially chains of sugar molecules.
Carbohydrates were grouped into two main categories:
- Simple carbohydrates included sugars such as fruit sugar (fructose), corn or grape sugar (dextrose or glucose), and table sugar (sucrose).
- Complex carbohydrates included everything made of three or more linked sugars.
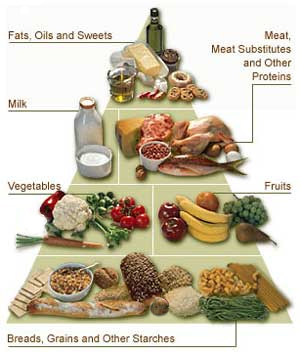
Examples
- Simple Carbohydrates
- Fruit juices
- Jams, jellies
- Candy
- Sugar, maple syrup, honey
- Sweeteners in food: dextrose, high fructose, corn syrup
- Kool-Aid
- Cakes, pies, cookies, ice cream, pudding
- Complex Carbohydrates
- Whole grain breads, crackers
- Rice
- Pasta
- Tortillas
- Beans
- Corn, peas, lima beans
Foods contain three major types of nutrients: carbohydrates (carbs), proteins and fats. Carbohydrate foods most often come from plants, such as fruits, vegetables and grains. Carbohydrates are chains of sugar molecules; thus, they have the greatest effect on blood-sugar levels when these chains are digested (broken down).
Complex carbohydrates are longer chains of sugars. They are absorbed more slowly into the blood and cause a slower change in blood sugar than simple carbohydrates. 90-100% of the carbohydrate (CHO) eaten converts to sugar (glucose) within 15 minutes to 1.5 hours. Only 58% of the ingested protein, and less than 10% of fat, are converted into sugar within several hours after consumption. Source
Carbohydrates and the Glycemic Index
A new system for classifying carbohydrates known as the glycemic index, measures how fast and how far blood sugar rises after you eat a food that contains carbohydrates
White bread, for example, is converted almost immediately to blood sugar, causing it to spike rapidly. It's classified as having a high glycemic index. Brown rice, in contrast, is digested more slowly, causing a lower and more gentle change in blood sugar. It has a low glycemic index.
Diets filled with high-glycemic-index foods, which cause quick and strong increases in blood sugar levels, have been linked to an increased risk for both diabetes and heart disease. Source
Glycemic Index
The glycemic index measures how fast a food is likely to raise your blood sugar. This can be helpfu. For example, if your blood sugar is low and continuing to drop during exercise, you would prefer to eat a carb that will raise your blood sugar quickly. On the other hand, if you would like to keep your blood sugar from dropping during a few hours of mild activity, you may prefer to eat a carb that has a lower glycemic index and longer action time. If your blood sugar tends to spike after breakfast, you may want to select a cereal that has a lower glycemic index.
Factors that influence how quickly the carbohydrates in food raise blood sugar include:
- Fiber content. Fiber shields the starchy carbohydrates in food immediate and rapid attack by digestive enzymes. This slows the release of sugar molecules into the bloodstream.
- Ripeness. Ripe fruits and vegetables tend to have more sugar than unripe ones, and so tend to have a higher glycemic index.
- Type of starch. Starch comes in many different configurations. Some are easier to break into sugar molecules than others. The starch in potatoes, for example, is digested and absorbed into the bloodstream relatively quickly.
- Fat content and acid content. The more fat or acid a food contains, the slower its carbohydrates are converted to sugar and absorbed into the bloodstream.
- Physical form. Finely ground grain is more rapidly digested, and so has a higher glycemic index, than more coarsely ground grain.
Carbohydrates and the Glycemic Load
- Low Glycemic Load
- High-fiber fruits and vegetables (not including potatoes)
- Bran cereals (1 oz)
- Many legumes, including chick peas, kidney beans, black beans, lentils, pinto beans (5 oz cooked, approx. 3/4 cup)
- Medium Glycemic Load
- Pearled barley: 1 cup cooked
- Brown rice: 3/4 cup cooked
- Oatmeal: 1 cup cooked
- Bulgur: 3/4 cup cooked
- Rice cakes: 3 cakes
- Whole grain breads: 1 slice
- Whole-grain pasta: 1 ¼ cup cooked
- No-sugar added fruit juices: 8 oz
- High Glycemic Load
- Baked potato
- French fries
- Refined cereal products: 1 oz
- Sugar-sweetened beverages: 12 oz
- Jelly beans: 10 large or 30 small
- Candy bars: 1 2-oz bar or 3 mini bars
- Couscous: 1 cup cooked
- Cranberry juice cocktail: 8 oz
- White basmati rice: 1 cup cooked
- White-flour pasta: 1¼ cup cooked
Carbohydrates and Diabetes
The long-held belief that eating foods containing "sugar" (sweets) will cause your blood glucose levels to rise higher and more quickly than starchy foods (bread, rice, pasta, etc.) has not been supported by scientific evidence. Both are forms of carbohydrates and both cause blood glucose to increase.
Research has shown that your total daily amount of carbohydrate intake affects your blood glucose levels. Carbohydrates have the most immediate effect on blood glucose levels, since carbohydrates are broken down into glucose (sugar) early during digestion. It is important to eat the suggested amount of carbohydrate at each meal, along with some protein, and fat.
Carbohydrates are mainly found in three food groups: Fruit; Milk and Yogurt; and Bread, Cereal, Rice, Pasta and Starchy Vegetables. You will need to consider the total amount of carbohydrates when working out your daily meal plan.
Carbohydrate counting Counting grams of carbohydrate and evenly distributing them at meals will help you manage your blood glucose. Carbohydrate counting is a method of meal planning that is a simple way to keep track of the amount of total carbohydrate you eat each day. Instead of following an exchange list, you monitor how much carbohydrate (sugars and starches) you eat daily. One carbohydrate choice is equal to 15 grams of carbohydrate. Note: your consumption of protein and fat still counts as calories.
With carbohydrate counting, you can pick up almost any food product off the shelf, read the label, and use the information about grams of carbohydrate to fit the food into your meal plan.
Carbohydrate counting is most useful for people who take multiple daily injections of insulin, use an insulin pump, or who want more flexibility and variety in their food choices. The amount and type of insulin you are prescribed may affect the flexibility of your meal plan.
A registered dietitian can help you determine how much carbohydrate, as well as other foods, you should include in your daily meal plan.
Carbohydrate counting may not be for everyone, and the traditional method of following food exchange lists may be used instead.
Fiber
Fiber is the indigestible part of plant foods that plays an important role in the digestive process. Fiber helps move foods along the digestive tract and adds bulk to stool to speed its passage through the bowel and promote regular bowel movements. Fiber also delays sugar absorption, helping to better control blood glucose levels. In addition, fiber binds with cholesterol and may reduce the level of cholesterol in the blood. Lastly, fiber helps prevent constipation and reduces the risk of certain intestinal disorders.
The goal for all Americans is to consume 25 to 35 grams of fiber per day. The best way to increase your fiber intake is to eat more of these fiber-rich foods:
- Fresh fruits and vegetables
- Cooked dried beans and peas
- Whole grain breads, cereals, and crackers
- Brown rice
- Bran products
Cheese
- Glycemic Index: 60
- Glycemic Index Rating: Medium
- Glycemic Response to Cheese Pizza: Carbs in Cheese Pizza have a medium effect on blood sugar levels.
- Constituents: protein, calcium, riboflavin and fat (as a cup of whole milk - Lactose sugar)
Proteins
Beans and legumes are another excellent source of protein for humans. Beans do not contain all the essential amino acids when cooked in their usual manner, but through sprouting (link to sprouting) them you can enjoy a full spectrum of amino acids in an alkaline forming low glycemic index food. Source
Vegetables
Vegetables contain low glycemic, often considered “free food” carbohydrate sources. Source
Legumes
Legumes are a dense source of carbohydrate and certain amino acids. They are rich in fiber which helps to keep you clean on the inside. Low on the glycemic index legumes are a great source of energy for an active body. Legumes: Almost all legumes have a moderate glycemic index. They also provide a source of water-soluble fiber that is valuable for lowering cholesterol. They also provide phytoestrogens, which may provide health benefits. Source
Dairy products
Most dairy products have a low glycemic index. However, some people do not tolerate dairy very well. Source
Fruits
Fruits are generally in the middle of the road in terms of glycemic index; but dried fruits, which are concentrated, have a higher index. Drinking fruit juices will definitely increase blood sugar release. Therefore, fruit juices should be limited or diluted with three-fourths water. Source
Most sweeteners such as honey, molasses, sugar, and white grape juice concentrate tend to have a high glycemic index. Rice syrup and granulated rice sweeteners may be used instead. The artificial sweetener aspartame may increase insulin resistance over time. Source
Grains
Grains such as rice, wheat, and corn tend to have a high glycemic index, but grains such as buckwheat, millet, barley, rye, and bulgur are actually quite low. For successful weight loss and blood sugar control, this group of foods should be used in moderation. Also, the addition of fats such as olive oil or butter (in moderation) can lower the glycemic index. Source
Regulation of glycemic index
Factors Affecting Glycemic Index of Foods are:
Soluble fiber
The gel-forming property of soluble fiber sources such as oats and barley has been proposed as the mechanism by which these grains reduce both cholesterol and glucose and insulin responses.
The high viscosity of the solution containing oat gum was concluded to be the property which delays gastric emptying and/or intestinal absorption resulting in these lower responses
Starch structure
Starch is composed of long chains of glucose (amylose) and highly branched chains of glucose (amylopectin). Hydrolysis of amylose would therefore result in fewer glucose molecules’ being freed at once than the hydrolysis of the highly branched amylopectin chains. Thus, high amylose content grains result in lower glucose responses than those which have a high content of amylopectin.
Particle size
Boiled whole kernels and larger particle sizes are associated with lower glucose and insulin responses for a variety of grain sources.
Conclusion
- The greater the particle size, the lower the glucose and insulin response.
- The greater the level of processing and refining, the higher the response.
- Grains with high levels of soluble beta glucans such as oats, rye and barley are generally more effective in improving insulin sensitivity than wheat, which contains predominantly insoluble dietary fiber.
- The high viscosity of these soluble fibers is partially responsible for these beneficial effects.
- Corn and rice can have either high or low glycemic indices because their amylose and amylopectin contents vary.
- Higher amylose content results in lower glucose and insulin responses.
- Replacing low fiber grain foods such as cornflakes or white bread with whole grain higher fiber or higher amylose content products will reduce risk of developing insulin resistance and obesity and improve the health of the American population.
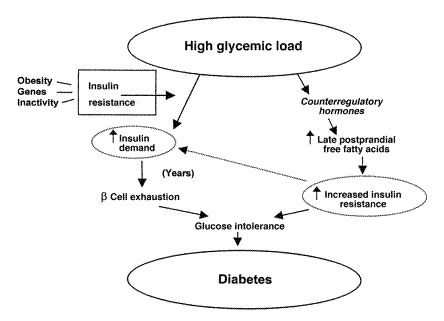
Potential mechanisms whereby high-glycemic-load diets could increase risk of type 2 diabetes
Overview of U.S. Food Customs and Terminology
Overview: Traditional "typical" meals
- Breakfast: O.J., bacon and eggs, sausage, pancakes, waffles, toast/french toast, cold cereals, oatmeal or cream of wheat, yogurt, applesauce, milk, coffee
- Brunch: above plus bagels & lox, fruits, Danish rolls
- Lunch: soup and sandwiches, cottage cheese, fruit
- Sandwich types: BLT, PBJ, tuna salad, egg salad, hero, submarine, grinder, hoagy, poor-boy, "Dagwood sandwich", Reuben sandwish, corned-beef, pita
- Dinner: fried chicken, steak, roast beef/pork, 2 vegetables (mashed potatos, corn, beans, peas, carrots, broccoli), tossed salad, cole slaw, jello "salads", dessert (apple pie [á la môde], cobbler, ice cream, cake).
- Meal drinks: coffee, iced tea, [iced coffee], beer, wine, milk, water, soft drinks
- Supper: hash, stew, hot sandwiches, leftovers
Holiday meals
- Thanksgiving: turkey and dressing, cranberry sauce, sweet potato casserole, corn, beans, peas, pumpkin pie ...
- Christmas: ham, turkey, fruitcake, mincemeat pie, Christmas stollen, egg nog, mulled wine,
- Independence Day: picnics with hot dogs, hamburgers, potato chips, pickles, roasted marshmallows, potato salad, 3-bean salad, pork & beans, ice cream, pie
- "Traditional" foods: succotash, squash, yams, sweet potatos, chili, corn bread, corn sticks, spoon bread, strawberry shortcake, fried catfish, sourdough bread
Food trends in recent years
- More fast-food restaurants, McDonalds, Burger King, Col. Sanders' Kentucky Fried Chicken, Arby's Roast Beef, Long John Silver's seafood, Domino's Pizza, Pizza Hut, Godfather's Pizza, Taco Bell, Roy Rogers, Orange Julius, Subway Shoppe, Au Bon Pain
- 24-hour 'convenience' restaurants, such as Denney's, Interstate Pancake House, Howard Johnson's (HoJo)
- Oriental restarants — take-out or dine-in
- "Power breakfasts," "brown-bag lunches," no-host bars
- "De-caf" coffee (and tea), more consumption of fish, grilled swordfish, etc.; rise of Mexican food dishes
Vast differences in U.S. regional & ethnic food cultures
- German, Polish, Scandinavian cultures in Midwest
- French cuisine around New Orleans, Maine
- Mexican/Spanish in Southwest, Florida
- Chinese, Japanese, Vietnamese, Thai in West/South
- Indian, Pakistani, Afghan, Ethiopian, etc. in East
- Native American Indian, etc., throughout U.S.
- Cuban, Puerto Rican, South American in Florida
Selected Main Courses
- Meatloaf, meatballs, creamed chipped beef,
- Ham (sugar-cured, "picnic," "rolled," "country", Virginia)
- Spaghetti & meatballs, macaroni & cheese
- Quiche, Turf & Surf, spareribs
- Chicken (fried, barbequed, fricasseed, roasted, grilled)
- Turkey (Butterball), duck, goose, lamb, pork
- Caesar salad, Chef's salad, chicken salad, tuna salad
- Catfish, lobster, salmon, trout, shrimp, swordfish, cod
Selected Side Dishes
- Beans (baked, green, lima, string, wax, kidney, shell, fava)
- Peas (green, in-the-pod, black-eyed, lentils, chickpeas)
- Zzucchini, other squashes
- Corn (on the cob, whole-kernel, creamed, hominy, grits)
- Succotash (corn & lima beans together)
- Rice (white, brown, wild; steamed, creamed, boiled, fried)
- Broccoli, asparagus, okra, spinach, kohlrabi, turnips, chard
- Noodles, macaroni, dumplings, potato pancakes
- Cottage cheese, sliced fruit
Selected Soups
- Clam chowder, chicken, chicken-noodle, black bean, pea
- Tomato soup, creamed celery/potato soups, onion/cheese soups
- Gumbos, jambalayas, vichyssoise, Scotch broth, shrimp bisque
Selected Desserts
- Various pies, cakes, cobblers, cookies, puddings, custards
- ice cream, sherbet, frozen yogurt, brownies, fudge, mousse
- fruit compotes, melons, baked alaska, muffins, crepes, soufflés
Party and Reception or other "Occasion" Foods
- Hors d'oeuvres, dips, guacamole, pretzels, bread sticks, (cocktail party 'finger food')
- Chicken wings, quiches, meatballs, turkey or ham or chicken 'rolls' or 'logs'
- Frankfurters, potato chips & salad, dill pickles, french fries
- Toasted marshmallows, peanut butter fudge/brittle, popcorn balls, "s'mores"
- Frog legs, mountain oysters,
Common Ethnic Foods
- Tortillas, enchiladas, tacos, burritos, tamales, nachos
- Knockwurst, kielbasa, sauerkraut,
- Lasagne, canneloni, pastas, manicotti, ravioli, vermicelli
African-American "Soul" Food Examples
- Black-eyed peas and ham hocks, chitterlings, pork neck bones and sauerkraut, fried catfish, oxtail soup
- Biscuits, corn bread
- Collard greens, fried okra, grits
- Sweet potato pie
Wheat processing
AX-rich fiber was extracted from the byproduct of wheat-flour processing. Arabinoxylan (AX) is a hemicellulose that has a xylose backbone with arabinose side chains. Postprandial glucose and insulin responses were improved by ingestion of AX-rich fiber. Further research is required to determine whether AX-rich fiber is of benefit to people with type 2 diabetes. Source
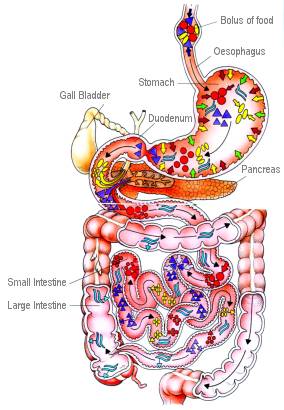
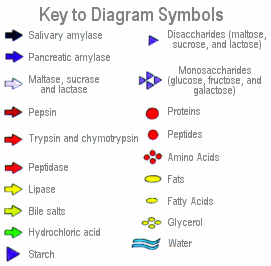
Digestive system
Detailed information on breakdown of food and fat
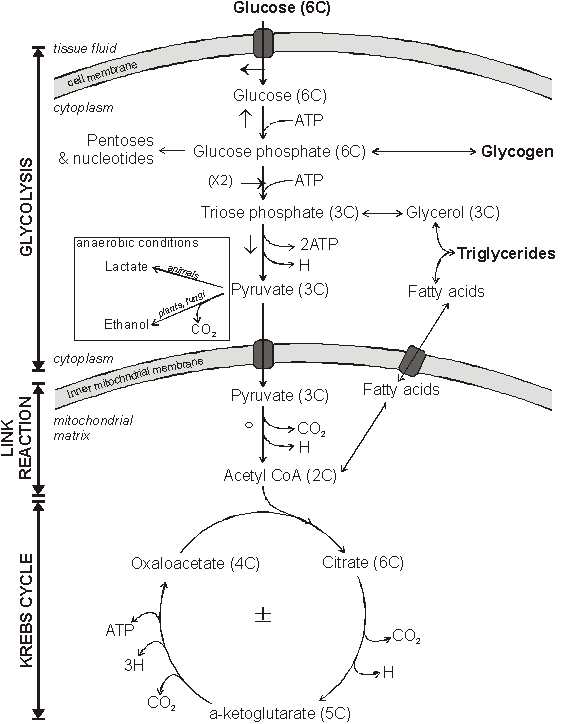
Metabolic pathways
Glucose regulation
Insulin overview
Insulin secretion
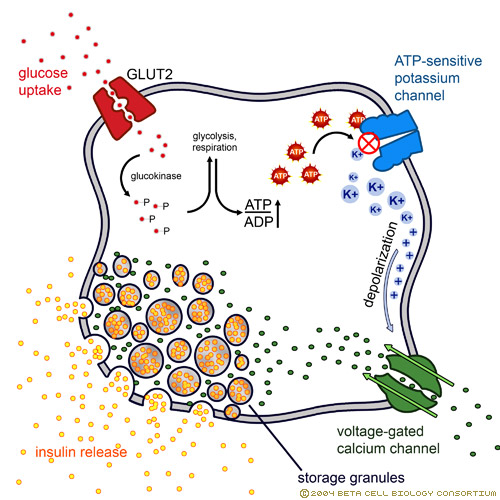
Insulin secretion in beta cells is triggered by rising blood glucose levels. Starting with the uptake of glucose by the GLUT2 transporter, the glycolytic phosphorylation of glucose causes a rise in the ATP:ADP ratio. This rise inactivates the potassium channel that depolarizes the membrane, causing the calcium channel to open up allowing calcium ions to flow inward. The ensuing rise in levels of calcium leads to the exocytotic release of insulin from their storage granule.
How insulin works
Insulin molecules circulate throughout the blood stream until they bind to their associated (insulin) receptors. The insulin receptors promote the uptake of glucose into various tissues that contain type 4 glucose transporters (GLUT4). Such tissues include skeletal muscles (which burn glucose for energy) and fat tissues (which convert glucose to triglycerides for storage). The initial binding of insulin to its receptor initiates a signal transduction cascade that communicates the message delivered by insulin: remove glucose from blood plasma (see panel 3). Among the wide array of cellular responses resulting from insulin ‘activation,’ the key step in glucose metabolism is the immediate activation and increased levels of GLUT4 glucose transporters. By the facilitative transport of glucose into the cells, the glucose transporters effectively remove glucose from the blood stream. Insulin binding results in changes in the activities and concentrations of intracellular enzymes such as GLUT4. These changes can last from minutes to hours.
As important as insulin is to preventing too high of a blood glucose level, it is just as important that there not be too much insulin and hypoglycemia. As one step in monitoring insulin levels, the enzyme insulinase (found in the liver and kidneys) breaks down blood-circulating insulin resulting in a half-life of about six minutes for the hormone. This degradative process ensures that levels of circulating insulin are modulated and that blood glucose levels do not get dangerously low.
Insulin binding to the insulin receptor induces a signal transduction cascade which allows the glucose transporter (GLUT4) to transport glucose into the cell.
Analysis of Oreo cookies
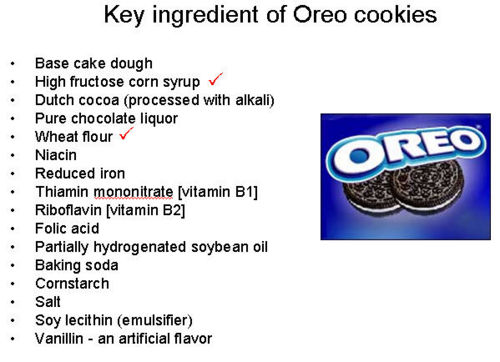
Key ingredient of Oreo cookies
Identifies the various ingredients of the Oreo cookies. The high fructose corn syrup and wheat flour have high glycemic index and are problematic to the diabetes. Thus we have done further deep dive on high fructose corn syrup and wheat flour
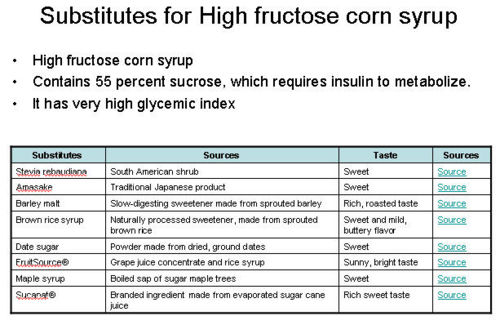
Substitutes for High fructose corn syrup
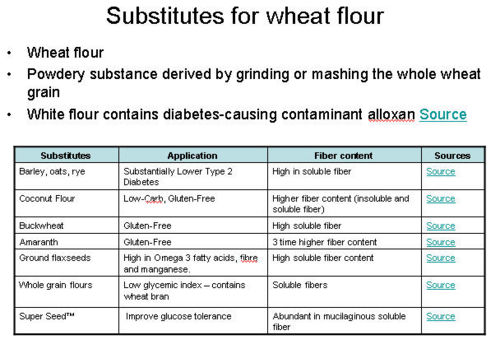
Substitutes for wheat flour
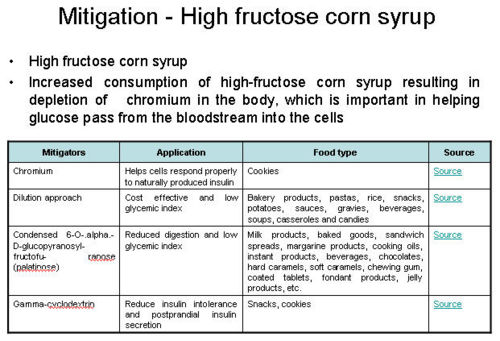
Mitigation - High fructose corn syrup
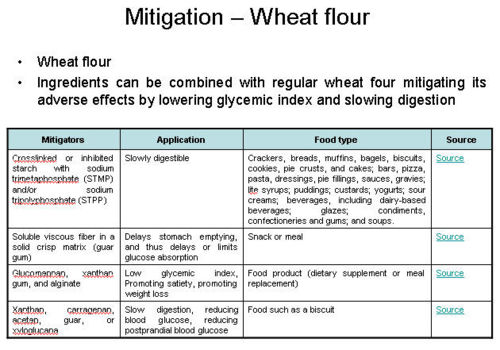
Mitigation – Wheat flour
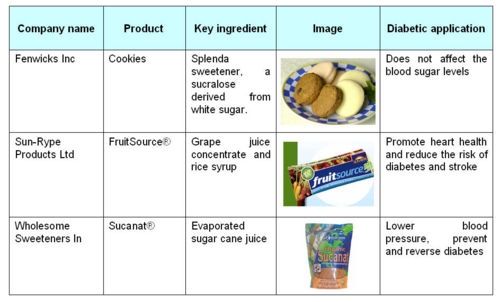
Products substitute for High fructose corn syrup
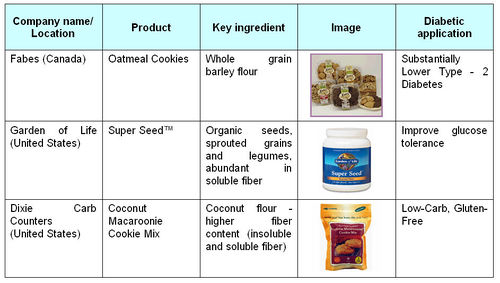
Products substitute for wheat flour
Presentation
- Slideset: Oreo Cookies and the sweeteners used in them
- Slideset: First draft
Like this report?
This is only a sample report with brief analysis
Dolcera can provide a comprehensive report customized to your needs
Contact Dolcera
| Samir Raiyani |
|---|
| Email: info@dolcera.com |
| Phone: +1-650-269-7952 |
