Cluster Analysis for TFT LCD Display Mobile Phones
Contents
Objective
To identify the appropriate cluster of smart-phones which are likey to be launched with AMOLED screens
A Comparison of LCD and OLED technologies
The two technologies can be compared on various attributes.
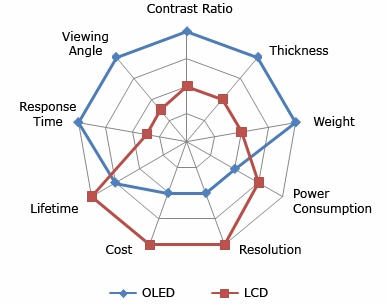
The radar graph here shows the comparison between OLED and TFT LCD.

The graph depicts the following things:
- OLEDs are thinner than LCDs.
- OLEDs are lighter in weight.
- OLEDs consume more power than LCDs: Power Consumption is a measure of the amount of power required by a display to produce a certain level of brightness. In theory, OLEDs have an inherent advantage in that they only consume power when they emit light. For example, a black OLED pixel consumes no power. An LCD backlight consumes constant power regardless of the image being displayed. However, LCDs still hold a slight advantage over the OLEDs currently in production. Future generations of OLED displays will be far more efficient than their LCD counterparts.
- OLEDs cost more: The Cost of an AM-LCD is currently about half that of a comparable AM-OLED display. This is again due to the maturity of the LCD manufacturing processes and facilities. The components comprising a typical LCD display are actually more expensive than those in an OLED display. However, OLED manufacturing facilities suffer from low yields, currently at 60%-70%. The higher cost and low output of OLED panels due to faulty yield closes off large portions of the potential market to panel makers. Also contributing to the cost is simply the inability of manufacturers to deliver enough units to satisfy large orders.
- OLEDs have a shorter lifespan as compared to LCDs.
- OLEDs have a faster response time. They have a response time of .01ms while LCDs have a response time about 8-12ms.
- OLEDs have a superior viewing angle of 180 degree while LCDs have a lower viewing angle.
Cluster Analysis
Methodology
Sample Definition: The sample space consists of moblie phones by leading players in the smart-phone mobile category. These models were identified from Gartner reports. The models of smart-phones launched in the last three years in North America were considered.
Sample Space:After defining the sample, the various key attributes of smart-phones like camera, display, etc. were defined. The data for these attributes for all the models was collected from the company websites as well as the following websites:
- www.phonearena.com
- www.phonegg.com
- www.mobile.am
The pricing information was obtained from
- www.fonearena.com
- www.india-cellular.com
- www.naaptaol.com
- www.mobilestore.com
- www.indiatimes.com.
After aggregating the data we used the k-clustering method to identify the different clusters for the samples. This technique aims to partition n observations into k clusters in which each observation belongs to the cluster with the nearest mean. Hence clusters of phones with similar attributes is achieved.
Samples were segregated into two broad categories - candy-bar phones and clamshell or sliding phones - with thickness being the differentiating parameter. This was done in order to mitigate any error due to the design of the phone(i.e. candybar,clamshell,slider), since the thicknes of the mobile could be a cause for erroneous results.
Results
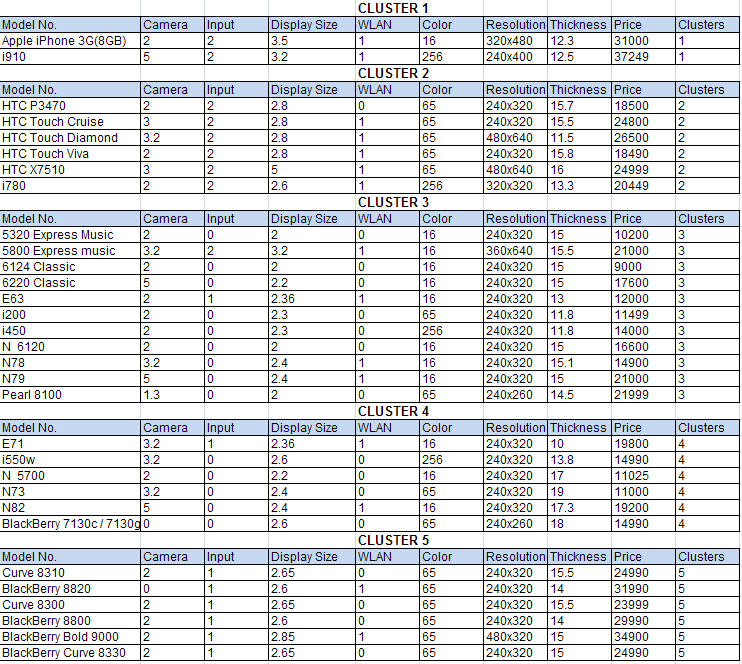
The sheet below shows the clusters formed for the candy-bar phones.
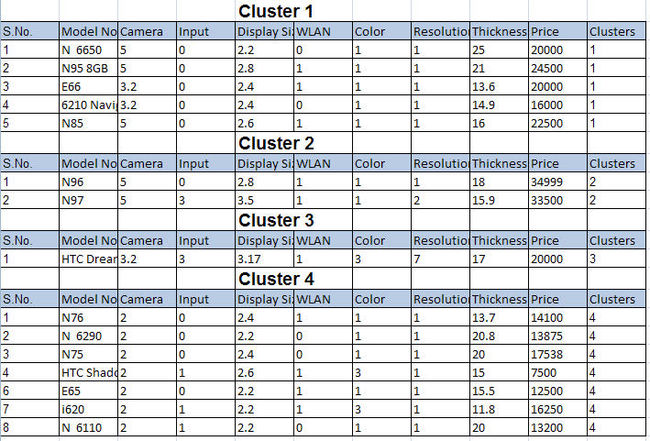
The sheet below shows the cluster formed for the clamshell/sliding phones.
Definition of Attributes:
- Camera : resolution in Megapixels
- Input method: two types of input methods - touchscreen and keyboard
- Display size: diagonal length of the displeay screen
- Resolution: display resolutions
- Color: display color
- Thickness: total thickness of the phone
Conclusion
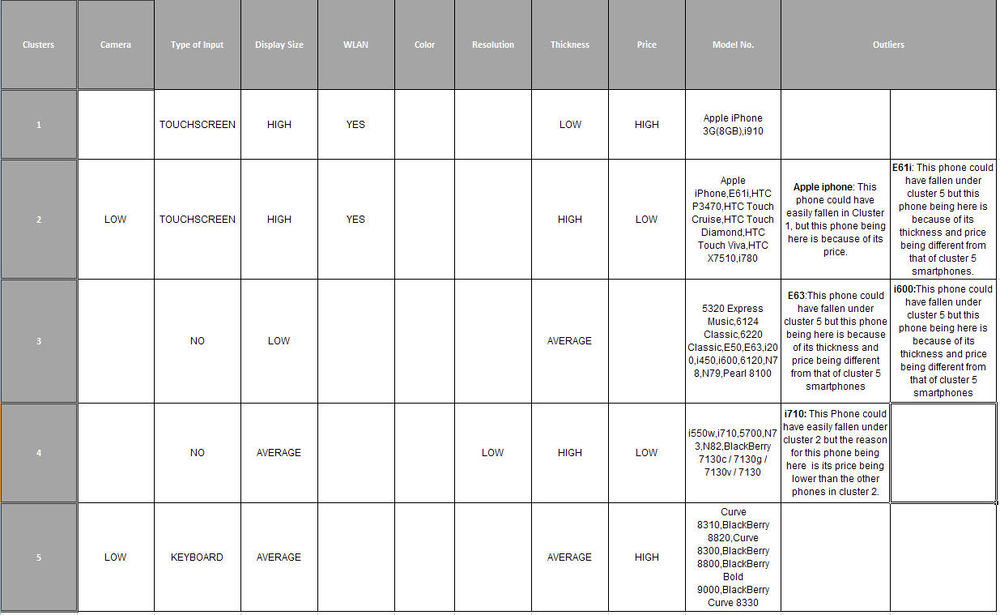
The matrices presented here show the common attributes for each cluster identified above and list the smart-phone models for each. The outliers are the models which could have fallen into some other cluster barring a particular attribute. This has been explained in the notes.
Candy-bar Phones
Clamshell/Sliding Phones
Selection of model
Using the analysis, one cluster of smart-phones likely to move to OLED technology was identified for each of the two categories. For the next stage of the research - that of forecasting sales of AMOLED display phones - would need the historical sales data of one particular model. For this purpose, Apple iPhone from the 2nd cluster of candy-bar phones was selected because of constraint of availabilty of sales data for other models like Blackberry, Nokia N96, HTC Dreamers etc.
Prices for AMOLED screens
Market data was collected for the prices of OLED screens by various manufacturers
| Company Name | Model Number | Size | Resolution | Colors | Price/unit(in USD) | ||
| 0-99 | 100-999 | 1000 ++ | |||||
| Chung Yuan Technology Co., Ltd | 2.2" | 220x176 | 20.00 | 16.5 | |||
| Digiprotek Markcom India P Ltd.(Densitron) | C0201QILK-C | 2 | 176xRGBx220 | 262K | 25.69 | 24.92 | 20.67 |
| C0240QGLA-T | 2.4 | 240xRGBx320 | 262K | 35.97 | 34.9 | 27.83 | |
| P0340WQLC-T | 3.45 | 480xRGBx272 | 16M | 85.65 | 83.1 | 47.72 | |
| P0430WQLC-T | 4.3 | 480xRGBx272 | 16M | 119.90 | 116.32 | 85.84 | |
| GLYN GmbH & Co. KG(CMEL) | C0201QILKC | 2 | 176x220 | 262K | 25.00 | 15 | |
| C0240QGLAT | 2.4 | 240xRGBx320 | 262K | 30.00 | 20 | ||
| C0283QGLDT | 2.83 | 240xRGBx320 | 262K | 38 | 26 | ||
| P0340WQLCT | 3.4 | 480xRGBx272 | 16M | 60.00 | 35 | ||
| P0430WQLCT | 4.3 | 480xRGBx272 | 16M | 90 | 63 | ||
| A4G Technologies(OSD) | OSD020AMQCIF | 2 | 176x220 | 262K | 22.50 | 20.98 | 19.10 |
| OSD024AMQV | 2.4 | 240x320 | 262K | 30.20 | 28.57 | 25.40 | |
| OSD0283AMQV | 2.83 | 240x320 | 262K | 38.30 | 36.16 | 33.63 | |
| OSD0340WQLC | 3.4 | 480x272 | 16M | 69.50 | 67.25 | 42.48 | |
| OSD0430WQLC-T | 4.3 | 480x272 | 16M | 109.00 | 87.00 | 72.00 | |
| Blaze Technology | BDO-0240QGLA-T | 2.4 | 240xRGBx320 | 262K | 20.8 | ||
| BDO-0283QGLD-T | 2.83 | 240xRGBx320 | 262K | 26.85 | |||
| BDO-0340WQLA-T | 3.4 | 480x272 | 16M | 39.5 | |||
| BDO-0430WQLA-T | 4.3 | 480x272 | 16M | 90.6 | |||


