- This report analyzes the organic light-emitting diode (OLED) industry in terms of products, applications, market size and structure, competitive environment and technology.
- Statistical data are included for estimation of adoption of OLED technology in mobile market. Cluster Analysis was performed on the existing TFT display mobile segment to identify the segments that are most likely to move into the OLED segment.
- All sales data are shown in million units, which are reported at the retail level. Calculations are based on historical data provided mainly for the 2002 to 2008 time frame with estimation of market saturation using the Bass Diffusion Model. The base year for the report is 2008.
Objective
- To estimate the market for OLED mobile phones.
- To forecast the adoption rate of OLED mobile phones.
Methodology
We have divided our analysis broadly into 3 parts:
- Cluster Analysis
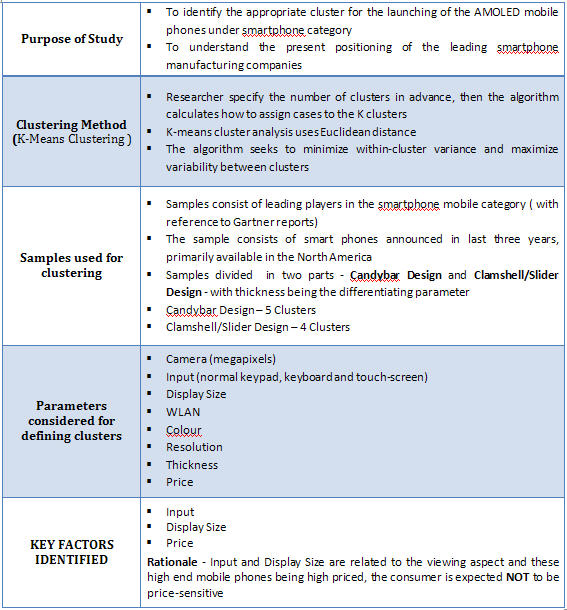
We performed Cluster Analysis to determine the mobile segments that are most likely to shift to the OLED mobile category. Cluster analysis is the assignment of objects into groups (called clusters) so that objects from the same cluster are more similar to each other than objects from different clusters. Objects in a cluster are similar to each other. To determine the cluster, certain characteristics like Input, Display Size etc. were considered.
- Bass Diffusion Modelling
After identifying the clusters we have applied the Bass Diffusion Model to forecast the adoption of the OLED mobiles among the consumers. This model is used to forecast the sales of a relatively new product by taking into consideration historical sales data of analogous products in the same or different product categories. For analogous products in the same product category (mobile phones) we have considered I-Phone sales as it is the most likely category that will shift to OLED Mobile Phones according to our Cluster Analysis. For Analogous products in the different product category we have considered LCD TV, Plasma Display TV and LCD monitor. Historical sales data of analogous products has been collected through various secondary sources like research reports and websites of the related companies.
OLED Technology - An Overview
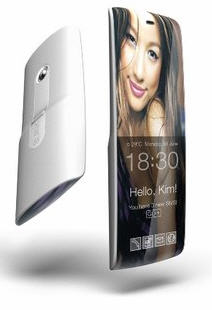
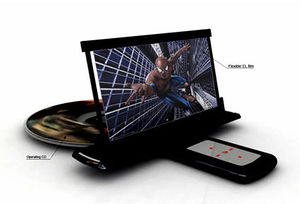
OLED (Organic Light Emitting Diodes) is a flat display technology, made by placing a series of organic thin films between two conductors. When electrical current is applied, a bright light is emitted. OLED use organic semiconductor materials instead of inorganic semiconductor materials used in conventional Light Emitting Diodes (LED). Through a process called electrophosphorescence, organic light-emitting diodes, or OLEDS, produce light in the presence of an electric current. Like any other diode, OLEDs only permit an electric current to pass in one direction. Unlike diodes made from inorganic semiconductors, however, OLEDs are very flexible because they are only 100 to 500 nanometers thick, which is about 200 times smaller than the thickness of a human hair. As a result, OLEDs are very flexible and can be made in very large sheets. They use less energy than LEDs as well.
The easiest way to understand OLEDs is to compare them to LCDs. LCDs are made by placing a color filter over a white backlight source – filtering out the colors that are not wanted for each pixel. If you want to display blue, you'll have to filter out green and red. OLEDs, on the other hand, are emissive – which means that you simply need to display the colors you need for each pixel – which is made from three color (RGB) OLED “pixels.”
OLED Construction
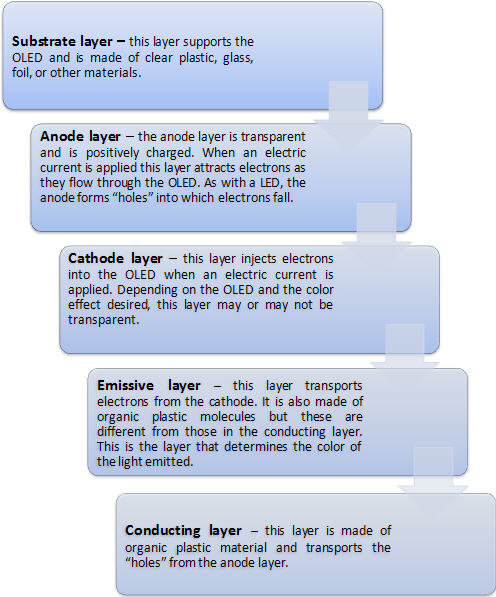
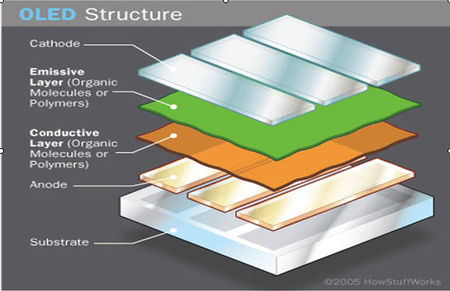
An OLED can be made of a single layer of organic material but multiple layers increase efficiency and effectiveness. A typical OLED is comprised of five layers of material as follows:
Types of OLED construction
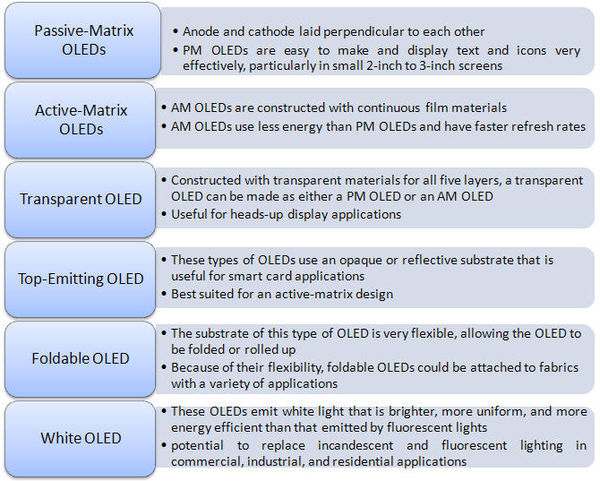
OLEDs can be constructed in a variety of ways to serve a variety of functions. While each type of construction uses the layers described previously, the manner in which each layer is built alters the way the OLED functions. The five most common types of OLEDs are as follows:
Applications of OLED
The ten biggest applications for OLEDs over the next eighteen months are:
- 1. Television
- 2. Cell phone
- 3. DVD
- 4. Camcorder
- 5. MP3
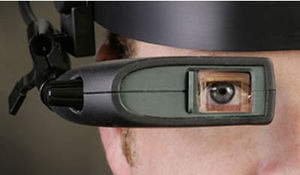
- 6. Near Eye
- 7. Games
- 8. PMP
- 9. Digital Still Camera
- 10. Car Audio
Key Players
The key players in the OLED mobile phone category are:
Advantages of OLED
- Brighter, clearer picture through wonderful color reproduction
- More efficient viewing angle
- Thinner, lighter in weight
- Low powered
- Fast response time
- Can be printed on various surfaces
Disdvantages of OLED
- Short term battery life
- Expensive
- Extremely sensitive to moisture
Cluster Analysis for TFT Display Mobile Phones
Out of those clusters, for comparison with OLED projections based on analogous products, we considered Apple iPhone because of constraint of availabilty of sales data for other models like Blackberry, Nokia N96, HTC Dreamers etc.
Bass Diffusion Analysis
One of the most important functions during the launch of a new product is to forecast the demand for that product, as it guides many other critical decisions faced by the company. Companies can schedule their production activities once they have an idea about the demand in the coming months or years. At a high level, Bass Diffusion Model is used to determine the shape of the curve representing the cumulative adoption of the new product. Bass describes the individuals who decide to adopt an innovation independently of the actions of others as innovators. Those who respond to the influences of the social system and obtain information about a new product from those who have already adopted the product are termed as imitators.
Some of the terms used in the model are:
- N(t): Total or cumulative number of consumers who have already adopted the new product through period t.
- N(t-1): Cumulative number of adopters for the new product through the previous time period (i.e., t – 1).
- S(t): Number of new adopters for the product during the time period t and can be expressed as N(t) – N(t – 1).
Three key parameters used in the Bass Diffusion Model are:
- m: Total market size, a terminal value of total adopters that will not exceed.
- p: Coefficient of innovation, represents the probability that an innovator will adopt at time t.
- q: Coefficient of imitation, represents the probability that an imitator will adopt at time t, through ‘word of mouth’ or ‘social contagion’ that result from interpersonal communications between adopters and non-adopters .
Some of the formulas used are:
S(t) = a + b N(t –1) + c (N(t – 1))²
Parameters a, b, and c are estimated via Non-Linear regression or using any other statistical software package,
The parameters m, p, and q are then determined by:
- m = (−b ± (b² – 4ac)½)/2c
- p = a/m
- q = –mc
Basic equation of Bass Model:
S(t) = [p + (q/m) N(t – 1)] [m – N(t – 1)]
Incorporating Marketing Mix variables:
S(t) = [p + (q/m) N(t – 1)] [m – N(t – 1)] * Z(t)
- Where Z(t)= 1 + α[P(t) – P(t – 1)]/P(t – 1)
- α is a coefficient that indicates the percentage increase in the speed of diffusion that results from a 1% decrease in price
- P(t)- price in period t
Adoption curve for new product are generally called S-curves because of their shape.
Predicting OLED phone sales using Analogous Products from different product categories
Assumptions for Choosing Analogous Products
It is assumed that the segments of customers that are display sensitive are likely to be early adopters of OLED mobile phones. These customers are likely to pay a premium price for technology that provides better display parameters. Some of the analogous products that replaced older technology on display characteristics in recent past are LCD TV (replaced CRT TV), Plasma TV and LCD monitor (replaced CRT monitors). LCD TV’s and monitors provide better visual impact (their contrast ratios are higher than CRT’s and they display a significant higher number of colors) but it may be argued that they are preferred since they save on space. However, while LCD’s do save on space, they have mostly replaced CRT’s for their demand despite their higher price.
We have considered the following products from different product categories as analogous to OLED phones:
- LCD TV
- Plasma Display TV
- LCD Monitor
| Similarities | LCD TV | Plasma Display TV | LCD Monitor |
| Display Sensitivity | Customers going for LCD TV are display sensitive, they prefer better visuals, so it is used as an analogous product as OLED provides better display features. | Customers going for Plasma Display TV are display sensitive, they prefer better visuals, so it is used as an analogous product as OLED provides better display features. | Customers going for LCD or TFT-LCD Monitor are display sensitive, they prefer better visuals, so it is used as an analogous product as OLED provides better display features. |
| Price Sensitivity | Customers adopting LCD TV are likely to pay price premiums for better display, so it is used an analogous product as OLED offers better resolution at marginally high price. | Customers adopting Plasma Display TV are likely to pay price premiums for better display, so it is used an analogous product as OLED offers better resolution at marginally high price. | Customers adopting LCD Monitor are likely to pay price premiums for better display, so it is used an analogous product as OLED offers better resolution at marginally high price. |
Estimation of Parameters
- LCD TV
- We determined the past sales data from 2002 to 2008 through secondary sources.
- Calculated the cumulative sales till last year for each year i.e. N(t-1)
- Ran Non-Linear regression to determine a, b and c.
- Calculated m, p and q from the values of a, b and c by putting them in the above mentioned formulas.
Same procedure is followed for Plasma Display TV and LCD Monitor.
OLED Mobile Phone projections based on Analogous Products
- 1. Weighted p and q are calculated based on the analogous products such as LCD TV, Plasma Display TV and LCD monitor.
- i. To judge the similarity of analogous products to OLED, we examined two criteria.
- a. Market Structure
- b. Product Characteristics
- a. Market Structure
- i. To judge the similarity of analogous products to OLED, we examined two criteria.
| Criterion | Description |
| Market structure | Market Structure is similar because LCD TV, Plasma Display TV and LCD Monitor are innovations in high end technology display field, provides better viewing experience to customer and are costly. |
| Product Characteristics | Product characteristics are similar as these products also provides better clarity in display with high resolution, better contrast ratio, wide viewing angle and with less response time. |
- ii. Depending upon the importance of the criteria, weighing factors were given to them. 0.4 for Market Structure and 0.6 for Product Characteristics.
- iii. Based on the similarity of the analogous product numerical weights were assigned to them on a scale of 1 to 10 for each criterion.
- iv. Weighted average p and q were calculated based on the p and q values of analogous products and the corresponding weights assigned to them. click here to view details
- ii. Depending upon the importance of the criteria, weighing factors were given to them. 0.4 for Market Structure and 0.6 for Product Characteristics.
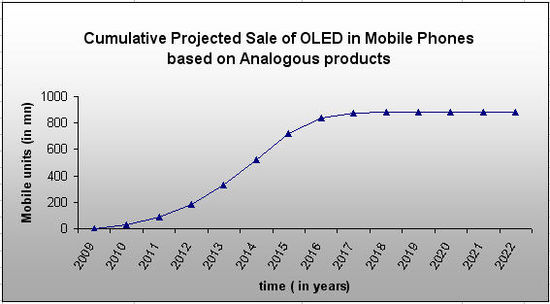
- 2. Market potential of OLED phones is taken as the m value of smartphones segment which is 884.07 mn.click here to view details
- 3. Then forecasted the adoption rate of OLED using the basic equation of Bass Model.click here to view details
- In 2009 and 2010 OLED Mobile Phone market will grow at a slow pace because the sale is mainly caused by innovators.
- From 2011 to 2015, market will grow at a very fast pace because of the large number of imitators started buying the product at this time. Sales will be driven by early adopters.
- In 2016 and 2017, market will grow at relatively slow rate, sales will be mainly caused by late adopters
- 2018 onwards growth is very less, sales will be caused by laggards. Also the market approaches it saturation point.
- From 2016 there is a dip in the sales, so, there could be a substitute by that time.
Comparison of Adoption rate of Innovators with those of Imitators
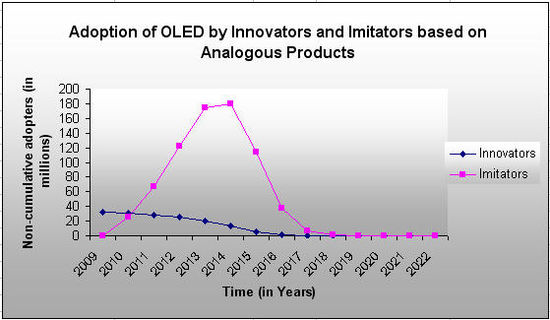
- We determined the sales caused by innovators and imitators in each year based on the values of p, q and m.
- m for each year is taken as m-N(t-1), it represents the number of consumers who have not previously adopted by the start of time t, this is the pool from which the new adoptions in the current period can occur. click here to view details
From the above graph we can see that the model is dominated by imitators than innovators. OLED Mobile Phones will get off a slow start in first 2 years. However, once a critical mass is reached by year 2, strong imitative effects will take over and the number of new innovators to adopt the product will slowly diminish over time.
OLED Mobile Phone Projections Based on I-Phone
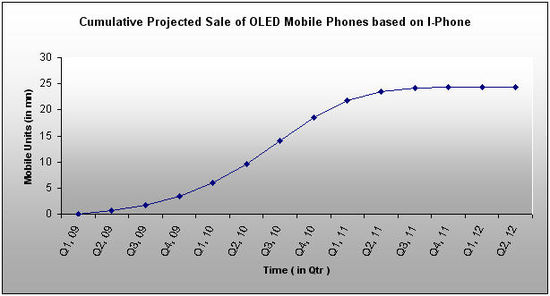
- p, q and m values are calculated for I-Phone from the past data .
- We forecasted the cumulative sales or adoption rate of OLED TV based on the p, q and m values.click here to view details
- From Q1, 09 to Q3, 09 OLED Mobile Phone market will grow at a slow pace because the sale is mainly caused by innovators.
- From Q4, 09 to Q4, 10 market will grow at a very fast pace because of the large number of imitators started buying the product at this time. Sales will be caused by early adopters.
- In Q1, 11 and Q3, 11 market will grow at relatively slow rate, sales will be mainly caused by late adopters
- Q4, 11 onwards growth is very less, sales will be caused by laggards. Also the market approaches it saturation point.
- From Q4, 10 there is a dip in the sales, so, there could be a substitute by that time.
Comparison of Adoption rate of Innovators with those of Imitators
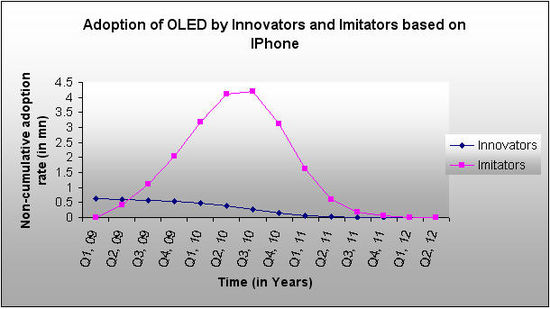
- We determined the sales caused by innovators and imitators in each year based on the values of p, q and m.
- m for each year is taken as m-N(t-1), it represents the number of consumers who have not previously adopted by the start of time t, this is the pool from which the new adoptions in the current period can occur. click here to view details
From the above graph we can see that the model is dominated by imitators than innovators. OLED Mobile Phones will get off a slow start in first 3 quarters. However, once a critical mass is reached by Q 3, strong imitative effects will take over and the number of new innovators to adopt the product will slowly diminish over time.
Comparing OLED Mobile Phone projections based on Analogous products and based on I-Phone
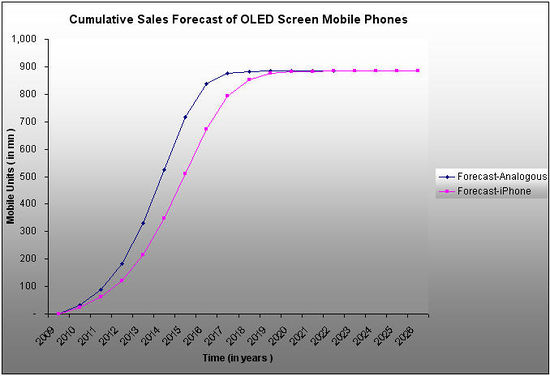
After projecting the adoption rate of OLED Mobile Phones based on Analogous products and based on IPhone, We compared both the projections to cross validate our results.click here for details
- Looking at the forecast of OLED screen Mobile Phones based on Analogous products and on I-Phone, we can see that both are almost similar to each other and moving in tandem, and finally converging at one point.
- This also validates our forecast.
Key Market Drivers and Constraints for OLED adoption
Market Drivers
Some of the major market drivers for OLED adoption are stated below:
- Mobile Internet - According to Nielsen Mobile, mobile Internet in the USA has now reached 40 million active users and will continue to grow. Consumer video constitute majority of this traffic.(Source: Marketingchart.com)
- Multimedia Applications – Increase in online video viewing from popular online video sites like youtube.com will act as a major growth driver. A bigger screen alongwith greater visual clarity are expected to be preferred by this segment.
- Technological Innovations – Recent technologies like 3G and 4G are emphasizing more on data and video content.
- Online Gaming – Online gaming content is increasing tremendously which is evident from the fact that since November 2007 to November 2008, this industry has witnessed YoY growth of 291% driven by high end phone category, mainly iPhone and Blackberry ( iPhone owners accounted for 14% of mobile game downloaders in November 2008 )
Two major inferences that may be drawn from the above are:
- 1. Consumers' emphasis on viewing is fast becoming a major factor for today's mobile industry.
- 2. Use of OLEDs will enable the mobile manufacturers to provide all these features in a better manner owing to its wide viewing angle, faster response time and high contrast ratio.
Market Constraints
The major constraints to adoption of OLED technology may be summarized below:
- Cost of OLED – Although the performance benefits of OLEDs surpass LCDs, the decreasing cost of LCDs and enhancement in LCD technology is key factor constraining the industry. LCD manufacturers will continue to improve their products and search for ways to reduce production costs.
- Sunlight Readability – OLED’s emit light. Bright sunlight interferes and washes out the image.
Sneak Preview of some models using OLED technology
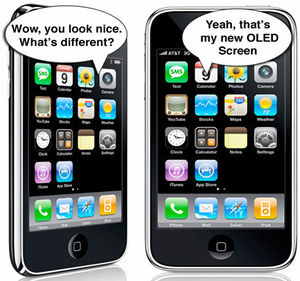
- 1. Apple iPhone - It’s nothing official at the moment, but word on the street is that Apple might have chosen a series of OLED displays for its next round of handsets. Such a move would certainly be in the best interests of battery life, as the iPhone isn’t noted for its battery capabilities. Considering the amount of new features that were announced in the iPhone 3.0 firmware update, it would be fairly practical to have a capacitive OLED display in the future.
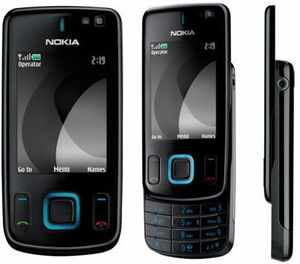
- 2. Nokia - Nokia 6600 Slide Mobile Phone is a 3G device with large OLED display and 3.2 megapixel camera. It has curved edges and with a weight of 110g is a bit heavy to hold. The 2.2” screen supports 16 million colors and comes with QVGA resolution. The dimensions of the phone are 90 x 45 x 14mm.
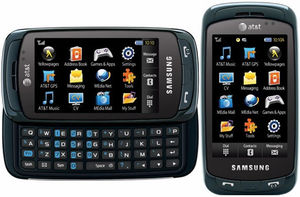
- 3. Samsung - Samsung A877 features include a 3.2-inch WQVGA AMOLED touchscreen, a 3 megapixel camera, GPS, HSDPA and Bluetooth.And as well at it supports AT&T’s 3G service.
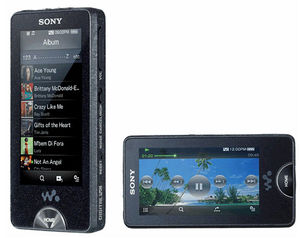
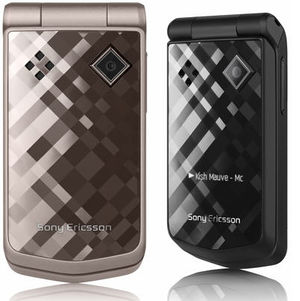
- 4. Sony - Sony Ericsson Z555 features a 1.9-inch LCD display, an OLED 128×36 external display, a 1.3 Megapixel camera with 4x digital zoom.
- 5. LG - One of the first handsets to get the new AM OLED, is already advanced LG SH150 DMB TV phone.
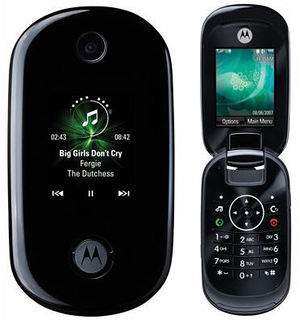
- 6. Motorola - The MOTO U9 is a Quad-band phone with a 2-inch QVGA LCD display, a 1.45-inch secondary OLED display, integrated music player, Bluetooth, 25MB internal memory and a microSD card slot.

