Key Information
| LG Electronics Ltd.(LGE) | |
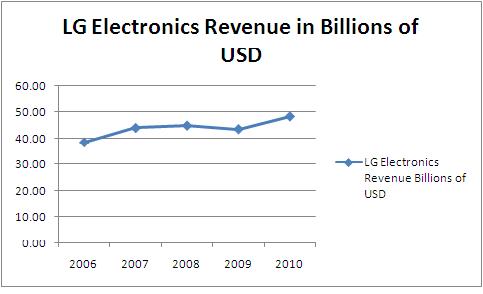
| Revenues | 2010: $48.27B |
| 2009: $43.52B | |
| 2008: $44.84B | |
| Revenue CAGR (2008 - 2010) | 3.8% |
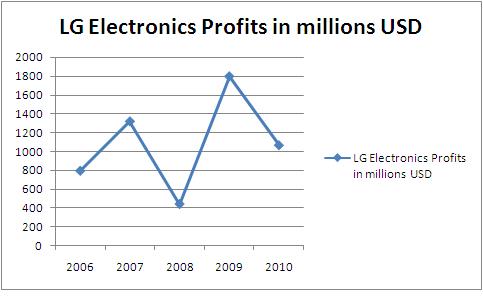
| Net profit (2010) | $1.14B |
| Net profit CAGR (2008 - 2010) | 67.2% |
| R&D expenses (Percentage of Revenue) | 2010:$1397.35M (2.37%) |
| 2009:$1182.33M (2.29%) | |
| 2008: $424.07M (0.82%) | |
| Number of employees | 82,772 |
| Year Established | 1958 |
| Headquarters | Seoul, South Korea |
| Key People | Koo Bon-joon (CEO) |
| Principal areas of business | Consumer Products Manufacturers: Consumer Electronics, Audio Equipment, Video Equipment, Appliances, Telecommunications Equipment |
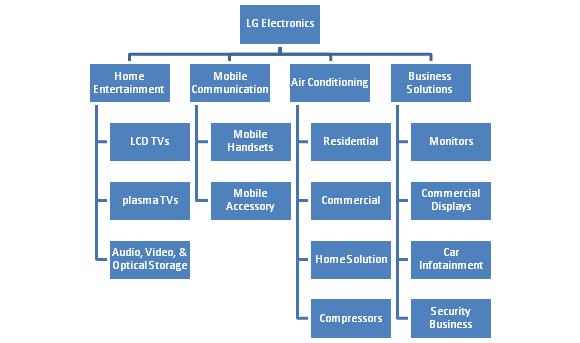
| Segmental breakdown based on turnover (2010) | Home Entertainment 20.48% Mobile Communications 12.84% Home App 9.90% Air Conditioning 4.47% Business Solution 4.48% |
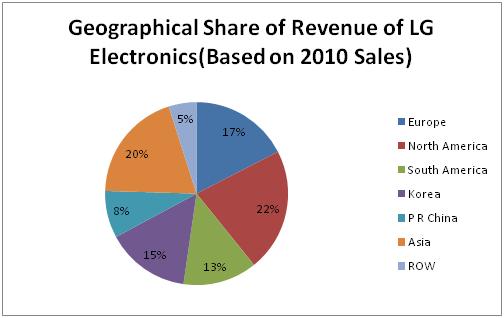
| Geographical breakdown based on turnover(2010) | Europe (17%) North America (22%) South America (13%) Korea (15%) P R China (8%) Asia (20%) ROW (5%) |
| Main Subsidiaries (2010) | LG Display (37.9%) LG Innotek (50.60%) |
| Recent Acquisition Summary | - Acquired Air-conditioning Division of LS Mtron for KRW 150 billion on 10th March 2011 |
| - Acquired Rental Business of Healthcare Rental Co. Ltd. | |
| Recent License Deals Summary | - Rovi and LG Electronics signed a licensing deal on 22nd June 2011 to further integrate DivX Technology in LGs consumer electronics products |
Overview
Vision
LG Electronics continues to pursue its 21st century vision of becoming a worldwide leader in digital—ensuring customer satisfaction through innovative products and superior service while aiming to rank among the world’s top three electronics, information, and telecommunications firms by 2010.
Years in Business
53 Years
Industry Type
Consumer Products Manufacturers
• Consumer Electronics
• Audio Equipment
• Video Equipment
• Appliances
• Telecommunications Equipment
Stock Exchanges listed in with their codes
Primary Symbol & Exchange:066570 - Ordinary Shares – Korea
Other Symbol & Exchange: LGLD - GDR - London
Contact
20, Youido-dong, Yongdungpo-gu
Seoul 150-721
South Korea
Phone +82-2-3777-1114
Fax +82-2-3777-3428
URL: http://www.lg.co.kr; http://www.lge.co.kr
Major Subsidiaries
| Sr. No | SUBSIDIARIES AND AFFILIATED COMPANIES | Stake |
| 1 | LG Display | 38% |
| 2 | LG INNOTEK | 48% |
| 3 | Hi Plaza | 100% |
| 4 | Hi Business Logitics | 100% |
| 5 | LG Ericsson | 50% |
| 6 | Hi M Solutek | 100% |
| 7 | Hi Tele Service | 100% |
| 8 | LG Public Small Business Cooperation Fund | 50% |
| 9 | Innovation Investment Fund | 83% |
| 10 | K-TV Tech Investment Fund | 100% |
Company Financials
Revenue Trends - 2006 to 2010
Profit Trends - 2006 to 2010
Geographical Analysis
| Major Shareholders | Stake |
| LG Corp. | 34.80% |
| National Pension Service | 5.04% |
Major Segments of LG Electronics
Typical Products of LG Electronics can be classified in following categories
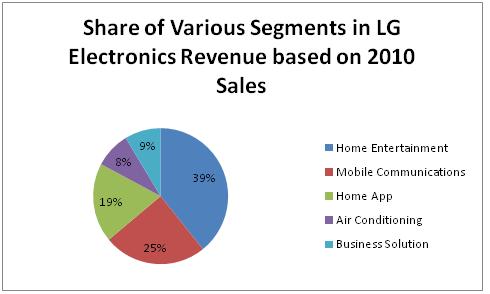
Revenue Breakdown among Various Categories based on 2010 Sales
Stock Performance of LG Electronics in 2010
Stock Price:
• Share Price (20-May-10): 101,000
• 52-Week High (02-Sep-09): 148,500
• 52-Week Low (20-May-10): 101,000
• Currency: KRW
Dividend Information:
• Dividend: 1,750 KRW
• Pay Date: April 16, 2010
• Ex-Dividend Date: December 29, 2009
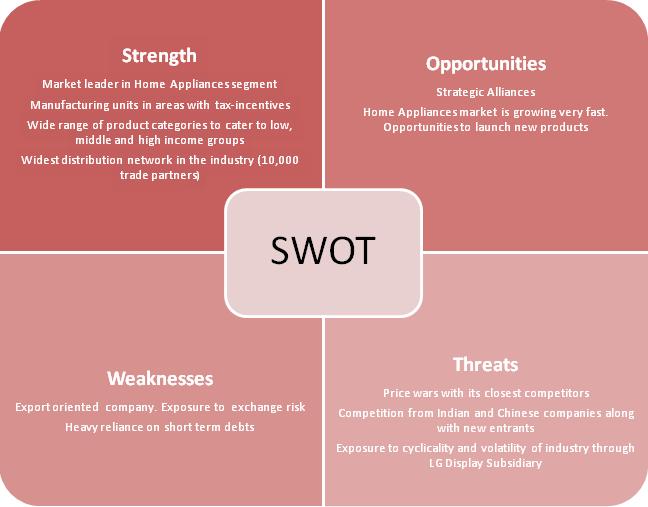
SWOT Analysis of LG Electronics
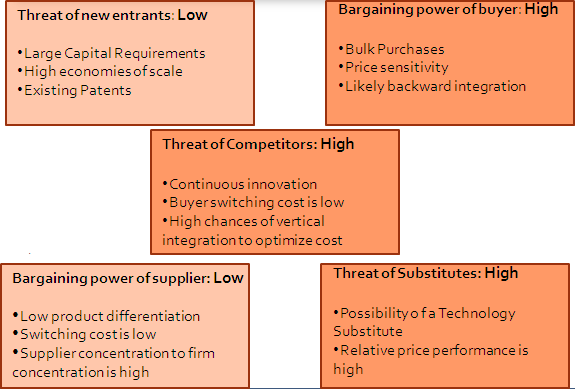
Porter's 5 Forces analysis- Display Industry
Analysis of display business
LG Display accounted for approximately 30% of LGE's revenues in 2010. Display business is capital-intensive, competitive and cyclical.
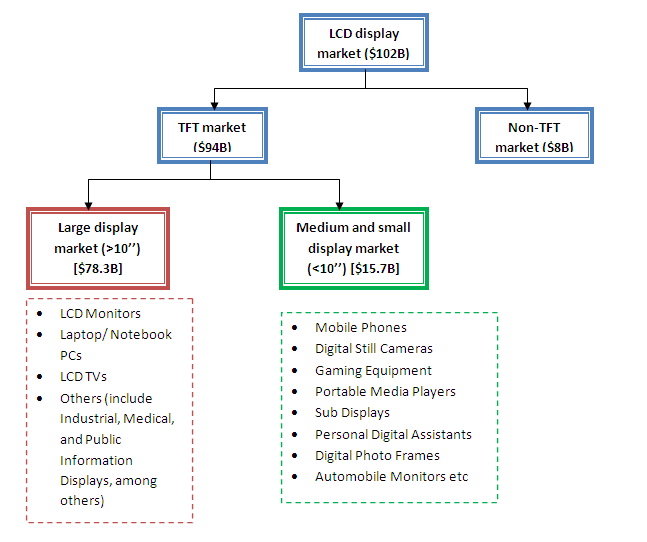
LCD display market in 2010
Large Area TFT market
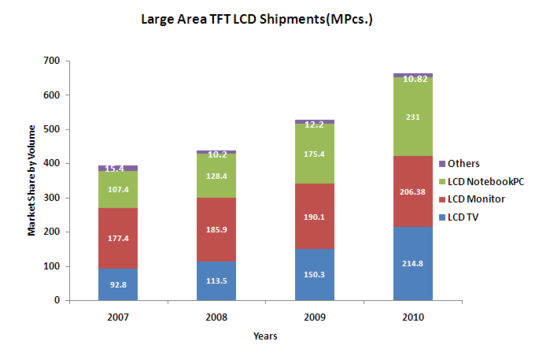
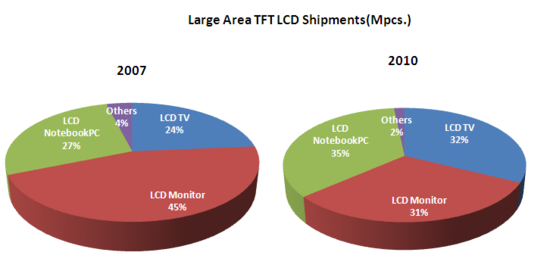
Year on year there was an increase in shipments for all the products of large area TFT LCD. In total the revenue grew by 25% in 2010 up from 20% in 2009. After recession and a laggard growth of 11.5% in 2008, the market has picked up and the revenue is growing.
- Market revenue overall is growing, but the most promising product and market that uses this technology is Television. With a growth of 42.9% in 2010 up from 32.4% in 2009, the market looks profitable.
- Notebook PC market also looks profitable, with a growth rate of 31.7%, but a decline from the previous year from 36.6%. The OLED technology is eating up the market share of the TFT LCD market share in this market.
