Premium Coffee Market Segmentation
Contents
[hide]Rationale Behind Study
- The first goal of the study is to define segments/communities to whom a premium brand of coffee can be cost effectively promoted.
- The second goal of this study is to identify if the defined segments/communities present a sufficient size to make coffee promotion viable.
Some background about coffee
Premium Grade Coffee:
Premium Grade Coffee is a general term that describes high quality coffee. Premium grade or premium coffee is also referred to as specialty or gourmet coffee. These terms underscore quality, which is easily perceived on our palate. High quality coffee beans generally produce a richer and more flavorful cup of coffee than most generic or store bought coffees. The Specialty Coffee Association of America reports that less than 8% of the world's production of coffee qualifies as specialty or premium. Typically these beans come from higher altitudes where ripening is slow and uniform. High grown beans are dense and take the rigors of roasting very well. When roasted to a medium dark level these beans produce a smooth and flavorful drink with intense aroma and rich flavor. Coffee drinkers who experience a superb cup of coffee seldom go back to drinking generic coffee. Savoring a cup of freshly roasted specialty coffee is an experience of its own and an affordable luxury.
Different types of Coffee Beans:
The most prevalent and used type of coffee beans are
| S.No. | Name | Characteristics |
| 1 | Arabica | It is considered to be far superior in flavor - the champagne of coffee |
| 2 | Robusta | Robusta, is higher in caffeine and tastes far bitterer and more acidic, which makes it less than preferable for most domestic use. |
Robusta is cheap and this makes it substitute for Arabica, which sees several coffee companies add small amounts of Robusta to their product lines as ’filler’.
The various types or varieties of coffee are listed in the table below:
| S.No. | Types or Varieties of Coffee | Definition |
| 1 | American (regular) roast | Beans are medium-roasted, resulting in a moderate brew, not too light or too heavy in flavor. |
| 2 | French roast and dark French roast | Heavily-roasted beans, a deep chocolate brown which produce a stronger coffee. |
| 3 | Italian roast | Glossy, brown-black, strongly flavored, used for espresso |
| 4 | European roast | Two-thirds heavy-roast beans blended with one-third regular-roast. |
| 5 | Viennese roast | One-third heavy-roast beans blended with two-thirds regular-roast. |
| 6 | Instant coffee | A powder made of heat-dried freshly brewed coffee. |
| 7 | Freeze-dried coffee | Brewed coffee that has been frozen into a slush before the water is evaporated, normally more expensive that instants but with a superior flavor. |
| 8 | Decaffeinated coffee | Caffeine is removed from the beans before roasting via the use of a chemical solvent (which disappears completely when the beans are roasted) or the Swiss water process which steams the beans and then scrapes off the caffeine-laden outer layers. |
Coffee Market: USA
Highlights
- The total sales of coffee in the USA USD 21.3 billions.
- 8 out of 10 Americans are coffee drinkers.
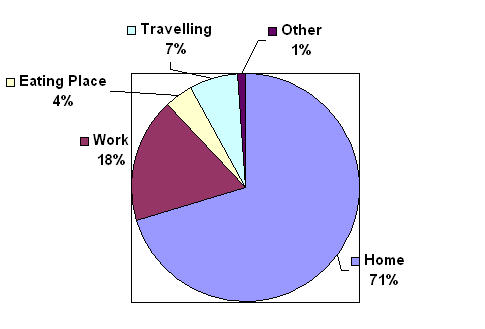
- 71% of All cups of coffee are consumed at home (notwithstanding increase in Specialty chains).
- Within retail (market of $9.8 billions), Grocery is the dominant channel with over 70% of retail coffee sales, and rest 28% by Alternate channels.
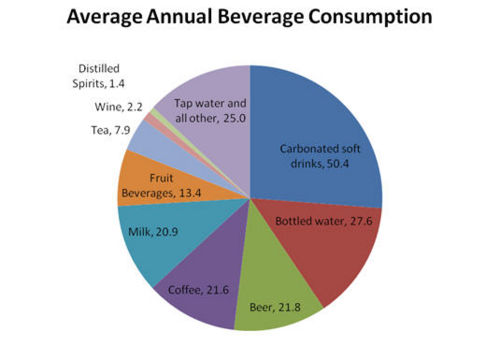
Consumption Pattern of Beverages
- The average annual beverage consumption of US population as per according to the 2008 Beverages Market Research Handbook
Distribution of coffee by segment
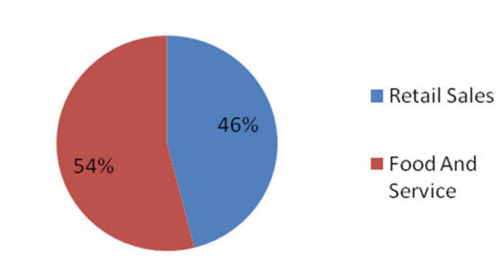
- Coffee is distributed primarily through two channels, retail and food service:
- Within retail (market of $9.8 billions), Grocery is the dominant channel with over 70% of retail coffee sales, and rest 28% by Alternate channels.
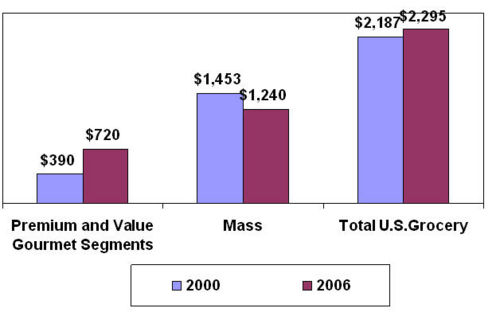
- Growth in the grocery channel is being driven by premium and value gourmet segments
- Premium and value gourmet segments are capturing market share.
- The below table gives sales figures of coffee through the grocery channel. Figures are in USD million
- The table below consists of brands and their market share % from a survey of 205,000 users conducted on AOL money and finance website.
| S.No. | Brand Name | Percentage Share |
| 1 | Folger’s | 30% |
| 2 | Maxwell House | 19% |
| 3 | Eight O’ Clock Coffee | 11% |
| 4 | Gevalia | 9% |
| 5 | Kona | 8% |
| 6 | Chock Full O’ Nuts | 7% |
| 7 | Green Mountain | 6% |
| 8 | Jamaican Blue Mountain | 6% |
| 9 | Newman’s Own | 2% |
| 10 | Bustelo | 2% |
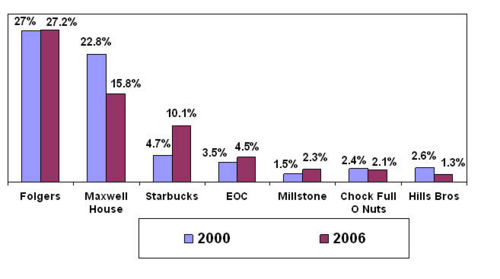
- The below drawn chart shows the comparison of various brands which are consumed at home by consumer.
- The percentage data indicates the market share of each of these brands in the years 2000 and 2006 respectively.
USA - Coffee Consumption by Place
The below mentioned figure gives break up of coffee consumption pattern by place
USA - Coffee Consumption by Age
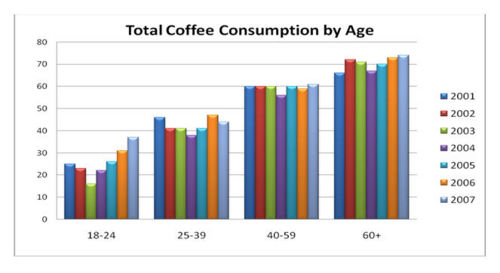
- If we see the below chart that’s depicts the data for the total coffee consumption by age , we can see there is continuous growth in the 18-24 yr segment, while last three years also shows an increase in consumption for age group of 60+.
- There is drop in consumption of coffee in age group of 25-39 years.
USA - Coffee Consumption (Out of Home data)
Out of Home coffee consumption:
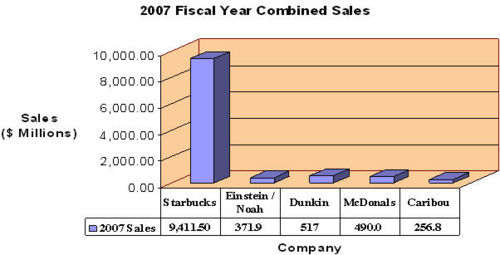
Below bar chart shows the coffee consumption at various coffee bars, restaurants or retail locations.
The out of home coffee market is mostly captured by Starbucks.
Few other leading companies which fall under these companies are
- The Coffee Bean & Tea Lea
- Peet’s Coffee & Tea
- The Coffee Beanery
- Tully’s Coffee
Supply Chain of Coffee Products:
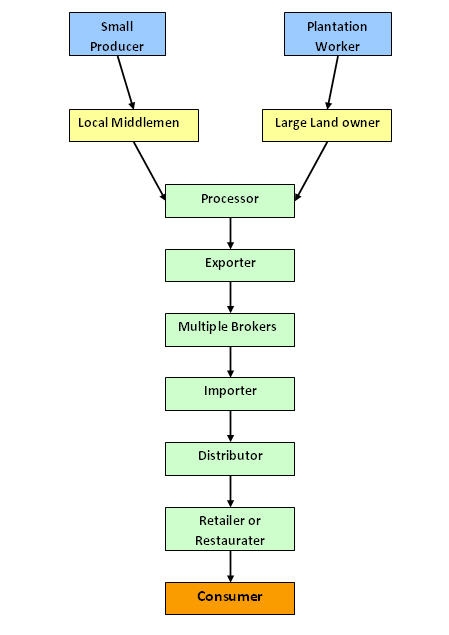
This below path very well depicts the supply chain of coffee for home consumption.
Business Research
- The goal for this business research report is to:-
- Identify unique segments, through hypothesis generation, where coffee for in-home consumption can be promoted
- Define these segments
- Determine places, online or offline, where these segments congregate
- Size up the segments to determine marketing potential of each segment
- Provide calendar view on "offline events" where these segments congregate for effective promotion planning
Segment Identification
- For segment identification we did the following:
- Identified online media where coffee lovers congregate
- Ranked and sorted the online media based on traffic (from Alexa ratings)
- Read up user generated content on such websites to identify unique segments/communities for coffee promotion
- For each unique segment/community, we then defined the place where they congregate offline
Segments Identified : Segments defined
| S. No. | Statements | Place of Usage | Communities | Source |
| 1 | People enjoy coffee as a cocktail drink. | The places where the coffee is served alongwith cocktail drink | Businessmen, Youngsters who like to hang out at bars | coffeetea.about.com |
| 2 | Companies have started pairing premium coffee with individual personality or individual needs depending on mood | Locations providing the customized coffee | Anyone who enjoys a customized coffee drink | ineedcoffee.com, gourmetcoffee.com |
| 3 | Messages pertaining to health | Any beverage outlet that is positioned to sell healthy drinks | Athletes, fitness conscious people | www.positivelycoffee.org, www.nescafe.com |
| 4 | Caffeine supports physical performance | Any place selling healthy beverage products | Athletes, fitness consicous people | www.positivelycoffee.org, www.nescafe.com |
| 5 | Coffee may reduce colon cancer risk among women | Any place or website where people with this disease can congregate | Women suffering from colon cancer | www.positivelycoffee.org, www.nescafe.com |
| 6 | Caffeine and exercise may help against sun-induced skin cancer | Any place or website where people with this disease can congregate | population suffering from skin cancer | www.positivelycoffee.org, www.nescafe.com |
| 7 | Coffee associated with lower liver cancer risk | Any place or website where people with this disease can congregate | population suffering from liver cancer | www.positivelycoffee.org, www.nescafe.com |
| 8 | Coffee may lessen after-exercise muscle soreness | Any place or website where people with this disease can congregate | people visiting ortheopaedist | www.positivelycoffee.org, www.nescafe.com |
| 9 | Coffee drinkers are less likely to develop Parkinson’s disease | Any place or website where people with this disease can congregate | Population suffering from parkinson disease | www.positivelycoffee.org, www.nescafe.com |
| 10 | Coffee consumption lowers diabetes risk | Any place or website where people with this disease can congregate | Persons treated for diabetes | www.positivelycoffee.org, www.nescafe.com |
| 11 | Coffee reduces cognitive decline in elderly men | age group bove 40 | www.positivelycoffee.org, www.nescafe.com | |
| 12 | Coffee can lower the risk of serious illnesses | www.positivelycoffee.org, www.nescafe.com | ||
| 13 | Coffee can ease headaches, prevent diseases | all classes | www.positivelycoffee.org, www.nescafe.com | |
| 14 | Church Goers drink coffee to keep themselves awake during the sermons. | Café shops located in or around church | church goers | ineedcoffee.com |
| 15 | Creation of artistic centers attracts coffee drinkers. | Various museums,art galleries etc. | Tourists, Adults | auburncoffee.com |
| 16 | People drink coffee at the various business conferences. | Any business conference where lots of people meet together | Business persons | |
| 17 | Coffee is consumed at International Coffee Festivals. | The places where the international festival occurs | Coffee lovers, business people that frequent these festivals | |
| 18 | High Street locations are places to which people’s visit. | Places located on high street locations where beverages can be sold | Business people, Shoppers, etc. | classes.bus.oregonstate.edu/Summer-05/ba469/Elton/Sector%20Analysis/Starbucks_compiled.ppt |
| 19 | During Public performances | Amphitheaters,community halls, opera houses etc. | Art lovers/Theatre lovers | classes.bus.oregonstate.edu/Summer-05/ba469/Elton/Sector%20Analysis/Starbucks_compiled.ppt |
| 20 | Charitable places | Charitable organisations and their events | Charitable organizations, Charitable events etc. | classes.bus.oregonstate.edu/Summer-05/ba469/Elton/Sector%20Analysis/Starbucks_compiled.ppt |
| 21 | Rural and off highway locations | Places on rural and off highway location selling beverages | youngsters,tourists | classes.bus.oregonstate.edu/Summer-05/ba469/Elton/Sector%20Analysis/Starbucks_compiled.ppt |
| 22 | At places that have kids playing area. | Any place with a secure kids playing area | Married Couple…Persons in Parenthood | kimboal.ba.ttu.edu |
| 23 | At opera theaters. | Opera theatres | Opera goers |
Segment Sizing
Each of the segments identified and defined are sized to determine the market attractiveness/potential of each segment. This is done as follows:
- For each segment, a potential place where they congregate offline in large groups has been defined.
- A detailed list of such offline events, up to a predetermined calendar date, has been made.
- The places where such events happen/will happen have been identified.
- For each individual event, a potential size has been estimated.
- The size estimates for each individual event is then aggregated.
- Based on this aggregation, the viability for promoting to each segment is determined.
Segment sizing of communities that follow Operas - Executive Summary
- Opera definition:- We have defined operas as acts that involve dialogs and music. Symphonies, and other solo performances like comedy acts by Robin Williams are considered targeting a different community.
- The Opera season in the USA peaks in October-November, then takes a dip to pick up again in February-April.
- The top 2 states where we can reach the highest potential audience through operas is (a) New York - 444,600 people and (b) California - 384,733 people. Hence, the company can focus on any one of these 2 states for new coffee introduction.
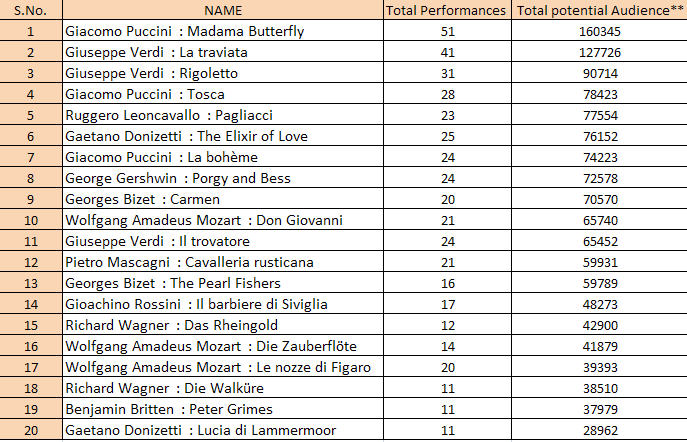
- Each of the top 20 shows caters to a potential audience of a 28,000 people and more thus making it a good promotion vehicle. The top 2 shows, Madam Butterfly and La-Traviata, have a potential to reach 100,000 plus people thus providing a good opportunity for promotion association.
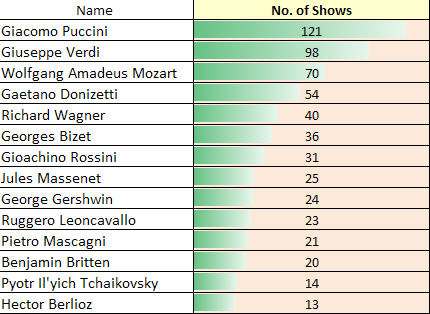
- The top music composers in the USA are Puccini and Verdi with more than 100 shows staged all over the USA. Association with their names can be a good promotion strategy for a brand.
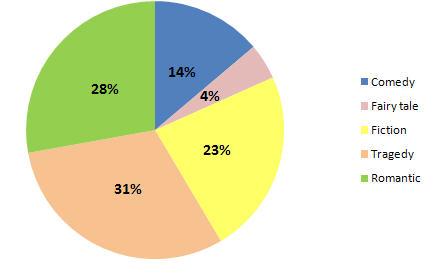
- Romance and Tragedy dominate the Opera scene in the USA. Emotional associations of a brand with Romance may appeal thus to a larger potential audience.
Opera Community Sizing: Methodology
- Opera community sizing method:-
- We identified a list of opera companies that produce operas in the USA.
- We made a detailed list of all operas produced by these companies, the number of times each opera is shown and the place where the opera is shown.
- We then made a ranking of the top opera shows in the USA, the composers whose music is associated with them, and the places where these shows are held.
- From the size of the opera theater where these shows are held, we estimated a potential audience each can cater to (since the calculation was for potential audience, we assumed 100% attendance).
Opera companies and their schedule of Operas
- This sheet also contains schedule of the events dated from Oct-2008 to July 2009.
- The dark green highlighted cell represents the total number of shows to be held in that opera house or conducted by particular opera company
The below link will guide to the full spread sheet.
Opera Companies and Schedule of Events
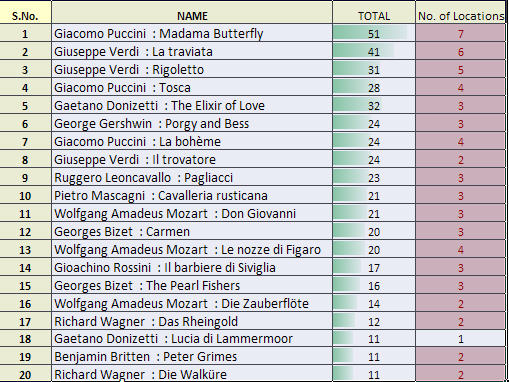
Compilation of Operas and their respective number of shows
- This excel sheets consists of the show name along with there composer, which are places in chronological order of number of times they are performed.
- It also contains details for number of location where a show is to be performed.
- It represent the number of performances that particular show has from oct-2008 to july-2009
- The red highlighted cells indicate that the show is being performed at "N" number of location, where N=Number in the respective cell
- This information can be utilized to target the community as per the popularity of the show.
The below link will guide to the full spread sheet
Compilation of shows by Composer
- This Sheet contains the information performing to various composers and the number of the performances of shows composed by them.
- The adjacent sheet contains the bar drawn in each cell for the comparative study of the various shows composed by composer.
- This information can be useful to target communities as per the popularity of composers.
The below link will guide to the full spread sheet
Estimating Potential Audience Data for each Opera show
- The below excel sheet shows the potential audience for the top 20 shows.
- This data an be used for targeting the shows with the larger number of potential audience.
- This spread sheet is being prepared using the same methodology as described above.
Classification of Opera Acts
We had also tried to analyse the types of the acts written by composer i.e. type of acts whether it being comedy,tragedy,romantic act etc.
The following pie chart suggest this percentages of various types.
