Difference between revisions of "Dolcera's Poster on Industrial Biotechnology"
| Line 20: | Line 20: | ||
We believe that this process of mapping the technology landscape for biotechnology, albeit customized for your needs, helps companies identify white spaces that they can potentially exploit for research or patenting opportunities. | We believe that this process of mapping the technology landscape for biotechnology, albeit customized for your needs, helps companies identify white spaces that they can potentially exploit for research or patenting opportunities. | ||
| − | [[Image:BiofuelDashboard.jpg| | + | [[Image:BiofuelDashboard.jpg|1200px|center]] |
Revision as of 02:27, 14 May 2008
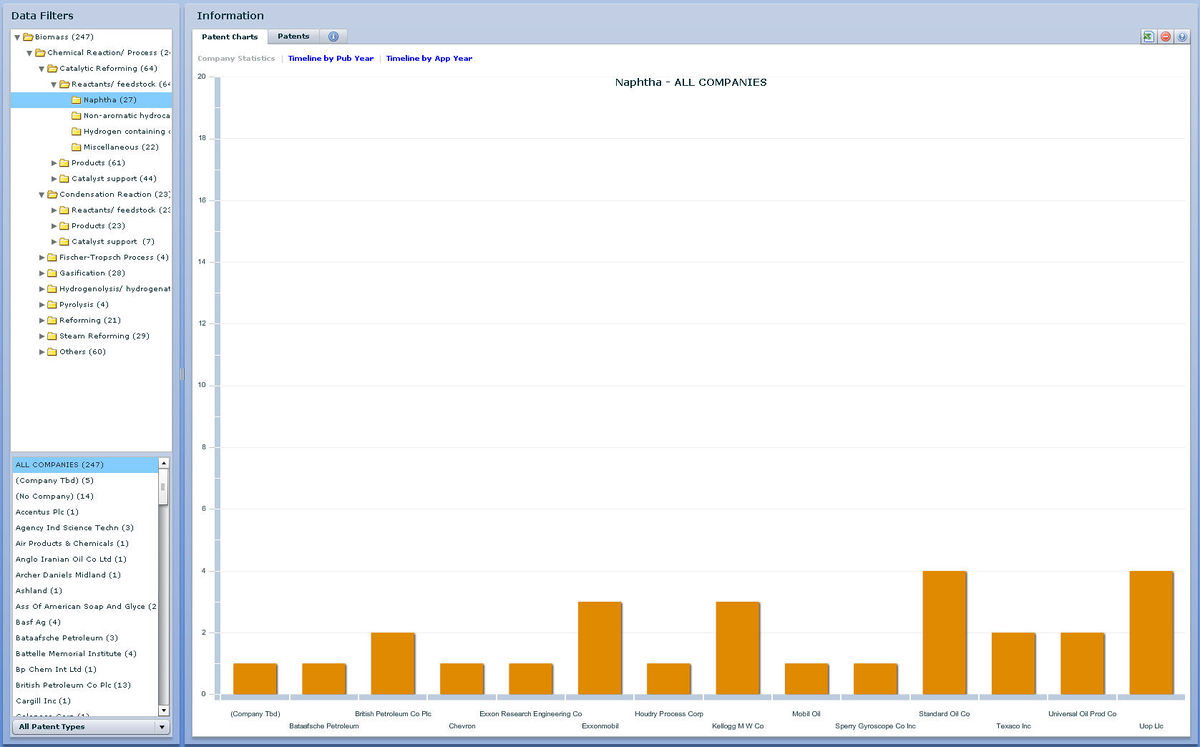
Using Dashboard for innovation in Industrial Biotechnology
There is a need for information visualization tools that can map thousands of patents, technical literature etc. in Industrial Biotechnology world to fully understand the universe of organisms, enzymes, feedstock, products and by-products and the inter-relationships between them.
To solve the above problem, Dolcera builds customized dashboards, with customized categorization, for Industrial biotechnology companies helping them map innovation to the following basic variables:
- Various feedstock
- Pre-treatment methods for feedstock
- A variety of enzymes, bacteria, fungi, yeast or a modified version of any of these that feed on feedstock
- Output or products that are obtained when the enzymes or bacteria or fungi or yeast feed on these feedstock.
Such detailed mapping of patents+technical literature activity to the above categories with the dashboard visualization tool helps companies map the entire technology landscape.
We believe that this process of mapping the technology landscape for biotechnology, albeit customized for your needs, helps companies identify white spaces that they can potentially exploit for research or patenting opportunities.
