Difference between revisions of "Nonprofit Event Management- Business Models"
From DolceraWiki
(→Mind map: Nonprofit Event Management) |
(→Mind map: Nonprofit Event Management) |
||
| Line 199: | Line 199: | ||
{|border="2" cellspacing="0" cellpadding="4" width="100%" | {|border="2" cellspacing="0" cellpadding="4" width="100%" | ||
| − | |<mm>[[Nonprofit_Event_Management_Activities.mm | + | |<mm>[[Nonprofit_Event_Management_Activities.mm]]</mm> |
|} | |} | ||
Revision as of 23:47, 6 October 2014
Contents
[hide]Nonprofit sector in USA
- 1.58 million nonprofits were registered with the Internal Revenue Service (IRS) in 2011, an increase of 21.5 percent from 2001.
- An estimated $836.9 billion was contributed to the U.S. economy by the nonprofit sector in 2011(Excluding nonprofit institutions serving government or business), which made up 5.6 percent of the country’s gross domestic product (GDP).
- In 2012, total private giving from individuals, foundations, and businesses was around $316.23 billion for the first time since the recession started, an increase of nearly 4 percent from 2011.
- In 2011, almost 1 million organizations were classified as public charities, which represents three-fifths of all registered nonprofits.
- Close to 56.8 percent of reporting organizations were public charities in 2011.Accounting for more than three-quarters of revenues and expenses for the nonprofit sector, public charities reported $1.59 trillion in revenues and $1.50 trillion in expenses. Assets held by public charities account for more than three-fifths of the sector total.
Source:The Urban Institute
Number and Finances of Reporting Public Charities by Subsector, 2011
| $ Billion | Percent (%) | |||||||
| Number | % | Revenues | Expenses | Assets | Revenues | Expenses | Assets | |
| All public charities | 335,037 | 100 | 1,593.6 | 1,498.2 | 2,856.0 | 100 | 100 | 100 |
|
35,164 | 10.5 | 30.8 | 28.1 | 101.7 | 1.9 | 1.9 | 3.6 |
|
58,568 | 17.5 | 269.2 | 243.8 | 851.4 | 16.9 | 16.3 | 29.8 |
|
2,094 | 0.6 | 174.8 | 158.8 | 548.8 | 11 | 10.6 | 19.2 |
|
56,474 | 16.9 | 94.4 | 85 | 302.6 | 5.9 | 5.7 | 10.6 |
|
15,110 | 4.5 | 14.9 | 13.4 | 36.3 | 0.9 | 0.9 | 1.3 |
|
41,619 | 12.4 | 942.4 | 895.3 | 1,202.6 | 59.1 | 59.8 | 42.1 |
|
7,308 | 2.2 | 798.5 | 758.4 | 973.3 | 50.1 | 50.6 | 34.1 |
|
34,311 | 10.2 | 143.8 | 136.9 | 229.3 | 9.0 | 9.1 | 8.0 |
|
116,643 | 34.8 | 202.4 | 195.8 | 303.7 | 12.7 | 13.1 | 10.6 |
|
7,007 | 2.1 | 28.9 | 28.1 | 30 | 1.8 | 1.9 | 1.1 |
|
39,415 | 11.8 | 91.4 | 81 | 300.1 | 5.7 | 5.4 | 10.5 |
|
21,511 | 6.4 | 13.8 | 12.6 | 30.2 | 0.9 | 0.8 | 1.1 |
Source:The Urban Institute
Steps in event management
Before the event
- Fundraising - which may involve one or more of the following types:
- Merchandising - Selling goods to raise fund.Organizations involved : Cafepress, SmartCause Digital
- Donation - Donations for the events could also be raised through certain online sources like Crowdrise
- Payment processing etc. - Certain bodies are present who work exclusively for non-profit organisation payment processing like Blackbaud, Moolah and BluePay
- Handling registration for the event
- Accounts book-keeping
- Creating event website and keeping it up-to-date like nonprofitCMS and Dot Org Web Works
- Recruitment of volunteers - companies like Bridgespan and Volunteer Match
- Marketing for the event - companies like Cvent and Coulter Companies
During the event
- Logistical support like food, accommodation, lighting, generators etc.
- Timekeeers - companies like Chronotrack
After the event
- Accounting and auditing of records
- Managing mailing list
- Communication with participants
- Communication with institution for which event was organized
Mind map: Nonprofit Event Management
Companies
Business Models
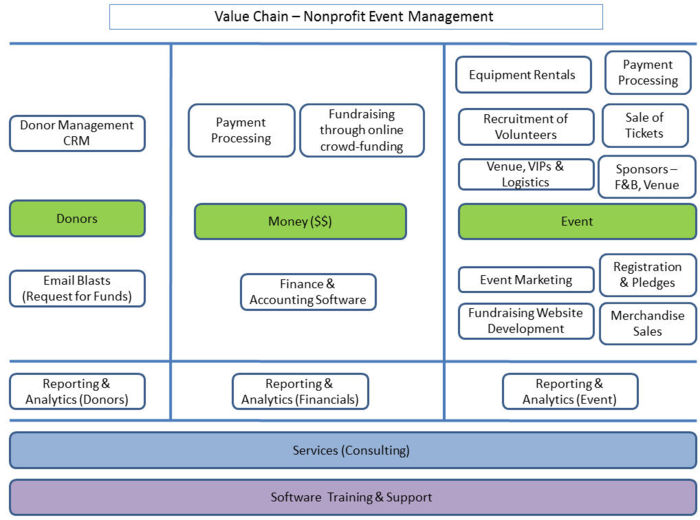
Value chain for nonprofit companies
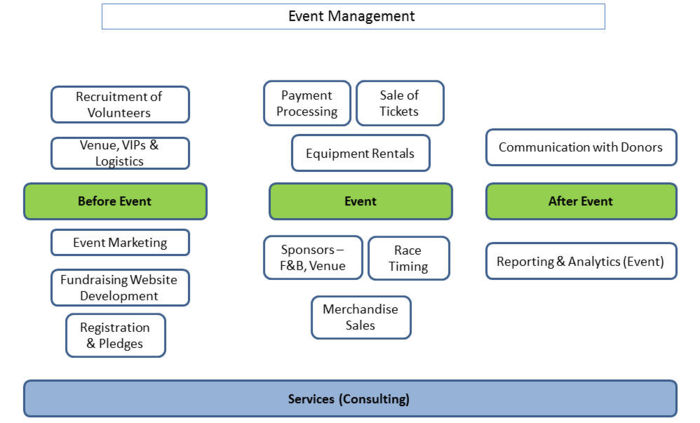
Value chain for event management
Fee structure
Crowdfunding platform business models
- Commissions on funds raised:
- This is by far the most common of all in the crowdfunding space. It's easy to understand for fund raisers and is also risk-free for them. In fact it's risk-free because you're the one bearing the risk, as you need to pay for software and support without the certainty of earning anything back. In addition, commissions require high volumes to make any good amount of money. Whether it is a crowdfunding or crowdinvesting platform, both have commission-based business models where they take a percentage of the profits (typically 4 – 7.5%) from every successfully funded campaign on their platform.
- Listing fees:
- This one is more common on equity crowdfunding platforms, simply because the structure of the investment doesn't allow for commissions. They can be one-off or monthly. Their advantage is that you're guaranteed to earn these fees whatever happens. On the flip side, you won't benefit from a project's potential success.
- Transaction fees:
- This is a middle-ground between commissions and listing fees. Every time someone makes an investment or a donation, you can add a non-refundable, fixed or variable transaction fee, paying for using the service. It's a little less popular but can prove effective in building sustainable revenues.
- Additional services:
- Most fundraisers will need videos, pictures and marketing. Some will also need more specific services like order management and fulfillment. By offering such added-value services you can make your users' lives much easier and earn more money.
Source:Towema

