Difference between revisions of "OLED Mobile Phones Market Research and Analysis Report"
(→Cluster Analysis for TFT Display Mobile Phones) |
(→Key Market Drivers and Constraints for OLED adoption) |
||
| Line 897: | Line 897: | ||
:* This validates the forecast | :* This validates the forecast | ||
| − | |||
| − | |||
| − | |||
| − | |||
| − | |||
| − | |||
| − | |||
| − | |||
| − | |||
| − | |||
| − | |||
| − | |||
| − | |||
| − | |||
| − | |||
| − | |||
| − | |||
| − | |||
| − | |||
| − | |||
| − | |||
| − | |||
| − | |||
| − | |||
| − | |||
| − | |||
| − | |||
==Sneak Preview of some models using OLED technology== | ==Sneak Preview of some models using OLED technology== | ||
{| class="wikitable" style="font-size:100%" border="1" cellpadding="5" cellspacing="0" width=80% | {| class="wikitable" style="font-size:100%" border="1" cellpadding="5" cellspacing="0" width=80% | ||
Revision as of 23:29, 13 September 2011
Executive Summary
- The OLED (Organic Light-Emitting Diode) technology is rapidly evolving, and these improvements are changing the dynamics display screens in mobile phones, TVs, camera, etc. The report provides a technological overview of OLEDS and includes comparisons with the rival technology of LCDs.
- This report analyses the Market for OLED display mobile phones in terms of products, applications, market size and structure, competitive environment and technology, and determines its future prospects.
- The statistical tools of Cluster Analysis and Regression are used to determine the segments of smart-phones likely to adopt OLED displays
- Bass Diffusion Model for adoption of new technologies is applied to forecast sales of OLED display based mobile phones. This forecast is arrived at by modeling the sales on the historical sales data of certain proxy products and is graphically presented in the report.
- The study reveals that by 2012 cumulative sale of OLED based mobile phone is expected to reach 183 million units and details the trend of these sales over the years
Research Objective
- To provide a Technology Overview for OLED Mobile Phones
- To provide a Market Overview for OLED Mobile Phones
- To provide a Market Estimate for OLED Mobile Phones
- To forecast the Adoption Rate of OLED Mobile Phones
Research Methodology
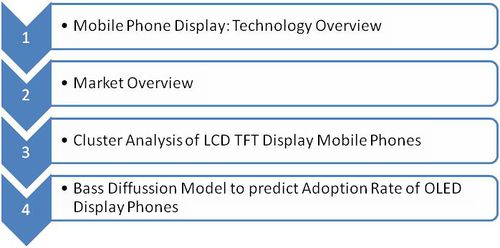
A four stage analysis was conducted:
Technology Overview
A brief understanding of the Technology behind the OLED displays forms the introduction to this report.
Market Overview
A detailed overview of the OLED Technology forms the basis of the Analysis performed using Base Diffusion Model.
Cluster Analysis
Cluster Analysis was used to determine a class of mobile handsets that is most likely to use OLED displays. Cluster analysis is a technique used to assign objects to groups (called clusters), such that objects from the same cluster are more similar to each other than objects from different clusters. To determine the cluster, certain attributes of a handset like input mode, display size, camera resolution, etc. were considered.
Bass Diffusion Model
The Bass Diffusion Model was used to forecast the adoption of the OLED display mobile phones by consumers. The Bass Diffusion model is a quantitative tool that describes the process of how new products get adopted as an interaction between users and potential users. In this analysis, the model was employed to forecast the sales of a new product by utilizing historical sales data of analogous products from the same product category as well as from a diverse product category. The market penetration for mobiles with OLED displays is arrived at with result for both the proxies.
Mobile Phone Display: Technology Overview
OLED (Organic Light Emitting Diodes) is a flat display technology, made by placing a series of organic thin films between two conductors. On applying an electric current, a bright light is emitted. OLEDs use organic semiconductor material instead of inorganic semiconductor material used in conventional Light Emitting Diodes (LEDs). Through a process called electrophosphorescence, OLEDs emit light in the presence of an electric current. Like any other diode, OLEDs permit electric current to pass only in one direction. Unlike diodes made from inorganic semiconductors, OLEDs are very flexible because they are only 100 to 500 nanometers thick - the human hair is 200 times thicker than it. As a result, OLED screens are very flexible and can be made in very large sheets. OLEDs use lesser energy than LEDs as well.
The easiest way to understand OLEDs is to compare them to LCDs. LCDs are made by placing a color filter over a white backlight source – filtering out the colors that are not wanted for each pixel. If you want to display blue, you'll have to filter out green and red. OLEDs, on the other hand, are emissive, which means that you simply need to display the colors you need for each pixel, which is made from three color (RGB) OLED “pixels.”
Mobile Phone Display Types
There are two types of display technologies which are used in mobile phones:
- Liquid Crystal Display (LCD)
- Organic Light-Emitting Diode (OLED)
Recent developments in LCD are Super LCD (S-LCD) and IPS (In-Plane Switching technology) Panel. IPS technology is used in Apple’s Retina display and LG’s NOVA display. OLED technology includes developments such as Super AMOLED, Super AMOLED Plus and ClearBlack.
Difference between LCD and OLED
The LCD uses light modulating properties of liquid crystals (LCs). The liquid crystals do not emit light directly. So, a light source is needed for proper viewing. The OLED uses organic compounds that illuminate when exposed to electric currents. Hence, a backlight is not required for OLEDs. This makes OLED displays thinner than LCD displays.
Difference between AMOLED and AMLCD
| Properties | AM OLED | AM LCD |
| Thickness/Weight | Thinner, best is 0.05 mm; lighter | Thicker, best is 0.8 mm; heavier |
| Diagonal Size | Limited to small and medium sizes; largest demo is around 40" | Can be manufactured larger; largest demo is ~100" |
| Viewing Angle | Up to 180 degrees | Narrower, depends on liquid crystal type |
| Color Gamut | >100% NTSC (top emission), around 70% NTSC (bottom); high at all gray levels | Around 70%, up to 100% NTSC (LED backlight and new color filter); falls at low gray levels |
| Color Reproduction | Better; gamut independent of view angle | Good; gamut changes with viewing angle |
| Resolution | Lower; 308 dpi (SM), 202 dpi (polymer) | Higher; best is 498 dpi |
| Response Time | Faster, nanoseconds. No motion blur, good for 3D | Slower, milliseconds |
| Contrast Ratio | Higher | Lower |
| Sunlight Readability | Better than transmissive LCD, worse than transflective LCD | Ok if transflective |
| Operating Temperature | Range is larger, can operate at low temps like -40°C | Range is smaller, lowest temp is -10°C |
| Power Consumption | Lower at typical video content, when around 30% of pixels are on | Higher at typical video content |
| Lifetime | Shorter, 5K to 30K hour, but improving | Much longer, above 50K hour |
| Manufacturing Investment | Lower, but lack of standards keeps the investment only slightly lower | Higher |
| Production Cost | Expensive; low yield and complex structure, potential to be low cost | Cheaper than AMOLED |
| Source: DisplaySearch | ||
OLED Construction
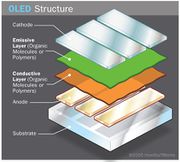
An OLED can be made of a single layer of organic material but multiple layers increase efficiency and effectiveness. A typical OLED is comprised of five layers of material:
| Layer | Description |
| Substrate layer | This layer supports the OLED and is made of clear plastic, glass, foil or other materials. |
| Anode layer | The anode layer is transparent and is positively charged. When an electric current is applied, this layer attracts electrons as they flow through the OLED. As with a LED, the anode forms "holes" onto which electrons fall. |
| Conducting layer | This layer is made of organic plastic material and transports the "holes" from the anode layer. |
| Emissive layer | This layer transports electrons from the cathode. It is also made of organic plastic molecules but there are different from those in the conducting layer. This is the layer that determines the color of the light emitted. |
| Cathode layer | This layer injects electrons into the OLED when an electric current is applied. Depending on the OLED and the color effect desired, this layer may or may not be transparent. |
Types of OLED Construction
OLEDs can be constructed in a variety of ways to serve a variety of functions. While each type of construction uses the layers described previously, the manner in which each layer is built alters the way the OLED functions. The six most common types of OLEDs are as follows:
| Type | Description |
| Passive-Matrix OLED | Anode and cathode laid perpendicular to each other |
| PM OLEDs are easy to make and display text and icons very effectively, particularly in small 2-inch to 3-inch screens | |
| Active-Matrix OLED | AM OLEDs are constructed with continuous film materials |
| AM OLEDs use less energy than PM OLEDs and have faster refresh rates | |
| Transparent OLED | Constructed with transparent materials for all five layers, a transparent OLED can be made as either a PM OLED or an AM OLED |
| Useful for heads-up display applications | |
| Top-Emitting OLED | These types of OLEDs use an opaque or reflective substrate that is useful for smart card applications |
| Best suited for an active-matrix design | |
| Foldable OLED | The substrate of this type of OLED is very flexible, allowing the OLED to be folded or rolled up |
| Because of their flexibility, foldable OLEDs could be attached to fabrics with a variety of applications | |
| White OLED | These OLEDs emit white light that is brighter, more uniform and more energy efficient than that emitted by fluorescent lights |
| Potential to replace incandescent and fluorescent lighting in commercial industrial, and residential applications |
Advantages and Disadvantages
| Advantages of OLED over LCD | As there is no backlighting, OLED displays offer deeper black levels than LCD displays |
| OLED displays have better contrast ratios | |
| Viewing angles offered by OLEDs is more than that offered by LCDs | |
| Disadvantages of OLED over LCD | Brightness levels of OLED display is less than that of LCD |
| Color in OLED displays are often oversaturated | |
| The red, green and blue sub-pixels deteriorate and lose efficiency at different rates, thus color consistency worsens over time |
OLED Screen Types in Mobile Phones
| Type | Description |
| AMOLED | AMOLED relies on a TFT backplane to switch individual pixels on and off. Active-matrix displays consume significantly less power than passive-matrix counterparts. This makes them well-suited for mobile devices. AMOLED displays are manufactured by printing electroluminescent materials onto a substrate. The relatively simplistic process suggests that OLEDs will ultimately become cheaper and easier to manufacture than LCDs. The creation of the substrate is the most difficult and expensive part of the process. Currently, AMOLED screens are limited in supply. Coupled with high demand, their availability is restricted and they are found in high-end smartphones. |
| Super AMOLED | Super-AMOLED displays are AMOLED displays with an integrated touch function. The original AMOLED screens had reduced visibility in direct sunlight. The thickness of the touch sensor is less than 0.001mm in Super AMOLED displays. This allows the screen to provide better images and to have great visibility even in direct sunlight. |
| ClearBlack | Nokia introduced a display similar to Samsung’s Super AMOLED known as the ClearBlack display. The ClearBlack display makes the screen more visible in direct sunlight. A polarized filter is added to the display. This allows the viewer to see through the screen’s reflection and view the images as they would appear under more ideal conditions. |
| Super AMOLED Plus | The Super AMOLED Plus features a traditional three sub-pixels of equal proportion within one pixel. It has an increased sub-pixel count and density. As a result, the display is much crisper, especially when it comes to text. The tighter spacing between pixels also results in better visibility under direct sunlight. The displays are also thinner, brighter and more efficient (by 18%) than the old Super AMOLED displays. |
Future OLED Mobile Screen Variations
| Type | Description |
| Transparent Displays | Transparent OLEDs have only transparent components (substrate, cathode and anode) and, when turned off, are up to 85 percent as transparent as their substrate. When a transparent OLED display is turned on, it allows light to pass in both directions. A transparent OLED display can be either active- or passive-matrix. TDK began production of a see-through OLED earlier this year. |
| Flexible Displays | Flexible OLEDs have substrates made of very flexible metallic foils or plastics. Flexible OLEDs are very lightweight and durable. Their use in devices such as cell phones and PDAs can reduce breakage, a major cause for return or repair. Samsung is readying flexible AMOLED displays for production next year. |
OLED Market Overview
OLED Market: Revenue Overview
- The Global OLED Display Market was estimated at $964 million for the year 2010.
- The market stood at $884 million in the year 2009, and showed a growth of 11% for 2010.
- The market is estimated to reach $1,428 million by the year 2013

OLED Market: Volume Overview
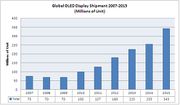
- The shipments of Organic Light-Emitting Diode (OLED) screens was estimated at 100 million units in 2010
- The shipments of Organic Light-Emitting Diode (OLED) screens are set to rise to 326.8 million units in 2015
- The market is going to be driven by booming demand for Active-Matrix (AM) displays for mobile handsets
- AM-OLED segment, which will boom to 261.5 million units in 2015, up more than twelve fold from 21.1 million in 2009
Market Potential by Geography
OLED Market Potential by Geography
The following chart illustrates the OLED Market Potential by Geography over the period 2004-2014:
Source: ICON Group International
AMOLED Market Potential by Geography
The following chart illustrates the AMOLED Market Potential by Geography over the period 2004-2014:
Source: ICON Group International
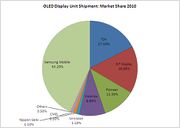
- Samsung Mobile leads the OLED Display Market with a market share of 43.2% as reported in 2010
- TDK is a distant 2nd with a market share of 17.5% and is closely followed by RiT Display with a share of 16.0%
The following chart illustrates the Global OLED Display Unit Shipment: Market Share, for the year 2010:
Like this report?
This is only a sample report with brief analysis
Dolcera can provide a comprehensive report customized to your needs
OLED Eco-System
The following dashboard illustrates all the Companies in the OLED Eco-System:
Source: OLED-info.com
OLED Market Drivers & Restraints
The following figure illustrates a Forcefield Analysis of Market Drivers and Restraints for OLED Market (2011-2017):

OLED Market Drivers
The following table illustrates the Impact Analysis of OLED Market Drivers over a period of time:
| Rank | Driver | 1-2 years | 3-4 Years | 5-7 years |
| 1 | Inherent Advantages of OLED Technology | Medium | High | Very High |
| 2 | Increasing Demand for Green Products | Medium | High | High |
| 3 | Increasing demand for OLED Display in Mobile Phones and Signage | Medium | Medium | High |
| 4 | Rising Potential of OLED TV’s | Low | Medium | Medium |
Inherent Advantages of OLED Technology
- OLED display offer sharper images and better contrast ratios, crisp colors and faster refresh rates compared to any existing display technology.
- OLED Technology also offers consumers better energy management as the whole system functions at optimal power and is of organic substrate.
- OLED displays are created by inserting thin organic films between two conductors and require no backlight; therefore, the displays are more compact and thinner.
- OLED displays, especially or television, are capable of offering viewers a viewing angle of 180 degrees
- As the benefits of OLED displays become more prominent, the demand for OLED manufacturing equipment is expected to increase in the next three to seven years.
Increasing Demand for Green Products
- The demand for lower power consumption , reduced material usage, and simplicity is expected to propel the OLED demand in the coming years
- The OLED manufacturing equipment market, however, is facing challenges due to its premium and manufacturing challenges. As Manufacturers realize the economies of scale, average selling price is expected to decline, further spurring demand.
- OLED TV market continues to evolve technologically and benefit from increasing demands for energy efficiency from consumers.
Increasing demand for OLED Displays in Mobile Phones and Signage
- Technology innovations, better functionalities and falling prices are expected to keep up the demand for OLED displays in mobile phones
- Mobile Phones accounted for over 82.0% of the Total OLED display market. With the success of mobile phones, such as the Galaxy, the demand for OLED displays for mobile applications is expected to increase
- The market is also expected to benefit from increasing demand for OLED displays used for signage
- These factors are expected to propel the sales of OLED during the medium and later part of the forecast period.
Rising Potential of OLED TVs
- The OLED market is yet to observe strong demand for TVs. High premium price and smaller display sizes are key restraints for customers. However, with increasing collaboration within the entire supply chain of the OLED market, the market is expected to experience gradual increase in attractive solutions. According to DisplaySearch, the OLED TV market is expected to generate revenue of $28 billion by 2017.
- The increasing momentum is expected to help commercialize the technology in the next five to seven years. Many display manufacturers have already set up dedicated manufacturing lines from Gen 3.5 to Gen 5.5.
- This is expected to propel OLED manufacturing equipment sales during the latter part of the forecasted period.
Cluster Analysis for TFT Display Mobile Phones
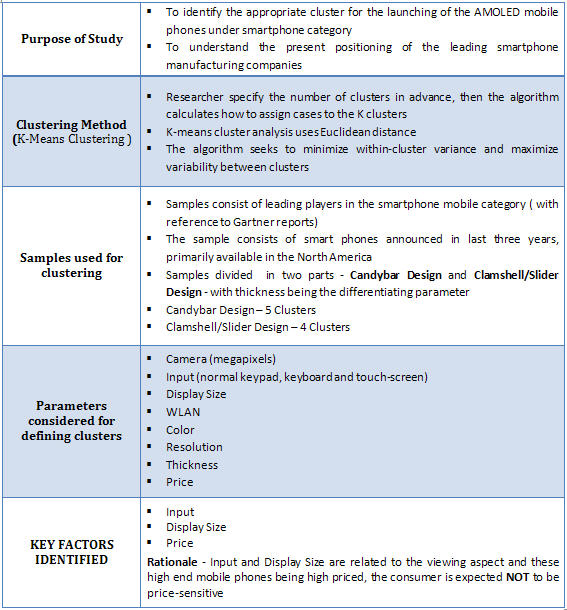
The table here summarizes the objective, methodology, procedure and result of the cluster analysis
Selection of model
Using the analysis, one cluster of smart-phones likely to move to OLED technology was identified for each of the two categories. For the next stage of the research - that of forecasting sales - would need the historical sales data of one particular model. For this purpose, Apple iPhone from the 2nd cluster of candy-bar phones was selected because of constraint of availability of sales data for other models like Blackberry, Nokia N96, HTC Dreamers etc.
A Comparison of LCD and OLED technologies
The radar graph here shows the comparison between OLED and TFT LCD.
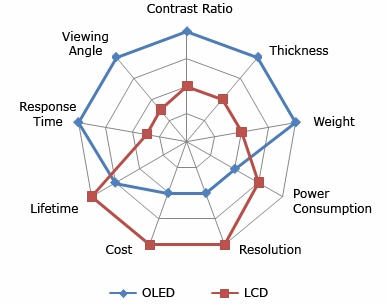
The graph depicts the following things:
- OLEDs are thinner than LCDs.
- OLEDs are lighter in weight.
- OLEDs consume more power than LCDs but OLEDs have an inherent advantage in that they only consume power when they emit light while an LCD backlight consumes constant power regardless of the image being displayed.
- OLEDs cost more: The Cost of an AM-LCD is currently about half that of a comparable AM-OLED display. This is due to the maturity of LCD manufacturing processes and facilities. OLED manufacturing facilities suffer from low yields, currently at 60%-70%.
- OLEDs have a shorter lifespan as compared to LCDs.
- OLEDs have a faster response time of .01ms while LCDs have a response time about 8-12ms.
- OLEDs have a superior viewing angle of 180 degree while LCDs have a lower viewing angle.
Cluster Analysis
Methodology
Sample Definition: The sample space consists of moblie phones by leading players in the smart-phone mobile category. These models were identified from Gartner reports. The models of smart-phones launched in the last three years in North America were considered.
Sample Space:After defining the sample, the various key attributes of smart-phones like camera, display, etc. were defined. The data for these attributes for all the models was collected from the company websites as well as the following websites:
- www.phonearena.com
- www.phonegg.com
- www.mobile.am
The pricing information was obtained from
- www.fonearena.com
- www.india-cellular.com
- www.naaptaol.com
- www.mobilestore.com
- www.indiatimes.com.
After aggregating the data we used the k-clustering method to identify the different clusters for the samples. This technique aims to partition n observations into k clusters in which each observation belongs to the cluster with the nearest mean. Hence clusters of phones with similar attributes is achieved.
Samples were segregated into two broad categories - candy-bar phones and clamshell or sliding phones - with thickness being the differentiating parameter. This was done in order to mitigate any error due to the design of the phone(i.e. candybar,clamshell,slider), since the thicknes of the mobile could be a cause for erroneous results.
Cluster analysis results
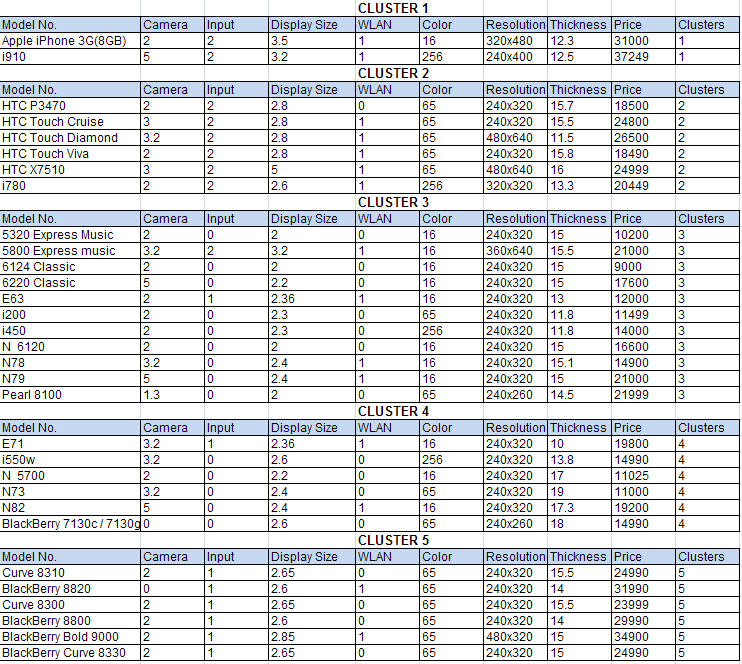
The sheet below shows the clusters formed for the candy-bar phones.
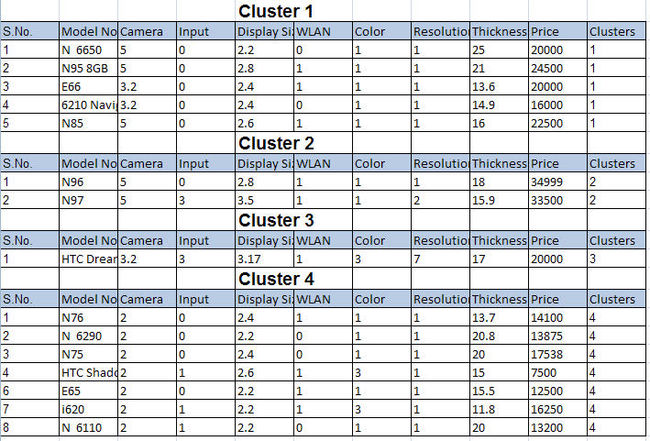
The sheet below shows the cluster formed for the clamshell/sliding phones.
Definition of Attributes:
- Camera : resolution in Megapixels
- Input method: two types of input methods - touchscreen and keyboard
- Display size: diagonal length of the displeay screen
- Resolution: display resolutions
- Color: display color
- Thickness: total thickness of the phone
The cluster analysis results and subsequent profiling of those clusters are summarized below:
Candy - Bar Phones
| Clusters | Cell phones | Profile |
| 1 | Apple iPhone, Samsung i910 | * Cluster 1 consists of high end cell phones * Cell phones falling in this cluster are touch screen phones with large display size * This is mainly targeting the premium market which is not price sensitive as the mobile phones in this cluster are priced high |
| 2 | HTC P3470, HTC touch cruise, HTC touch diamond, HTC touch viva, HTC X7510, i780 | * This cluster includes cell phones with moderate display size and having touch screen facility * Cell phones in this cluster are in the price range of medium to high, so it is targeting the upper middle to high class. * Almost all the mobile phones falling in this cluster are having WLAN facility indicating that this cluster target trendy class people and people who prefer online games and downloads on mobile phones |
| 3 | Nokia 5320 express music, Nokia 5800 express music, Nokia 6124 classic, Nokia 6220 classic, Nokia E63, i200, i450, N6120, N78, N79, Pearl 8100 | * Mobile phones in this cluster are targeted at the middle class as these phones are of moderate price and normal input * They have small display size and moderate camera resolution, which is in sync with their target market * Average thickness |
| 4 | E71, i550W, N5700, N73, N82, Blackberry 7130c/7130g | * This cluster consists of mobile phones having high camera resolution and normal input indicating that this cluster is for people who give high preference to clicking photographs on mobile phones * They have small display size with most of them not having the WLAN facility, so this is for people who low on using the browsing facilities * The target segment for this cluster is the middle class segment as the mobile phones are also moderately priced |
| 5 | Curve 8310, Blackberry 8820, Curve 8300, Blackberry 8800, Blackberry bold 9000, Blackberry curve 8330 | * It includes mobile phones having input through qwerty and with average display size * Target market is Business class people who prefer using email facility on mobiles * The mobile phones are low on camera resolution * All the mobiles in this cluster are high priced indicating that the targeted segment for this cluster is not price sensitive |
Clamshell Phones
| Clusters | Cell phones | Profile |
| 1 | N6650, N95 8GB, E66, 6210 navi, N85 | * This cluster consists of medium to high priced mobile phones and is targeted at upper middle class * These mobile phones have high camera resolution and normal keypad input * All the mobiles in this cluster have average display size having 16M colors |
| 2 | N96, N97 | * It includes mobile phones which are high priced and targeted at affluent people who are not price sensitive * The mobile phones in this cluster are characterized by high camera resolution, big display size and moderate thickness * WLAN facility and high graphic resolution in these mobile phones will attract people who prefer downloading and playing online games |
| 3 | HTC dream | * Mobile phones in this cluster are moderately priced and, targeted at the middle class and the upper middle class segment * These phones have high thickness and high camera resolution * These phones are WLAN enabled and have both qwerty keypad and touch screen input |
| 4 | N76, N6290, N75, HTC shadow, E65, i620, N6110 | * This cluster consists of mobile phones with low camera resolution and mainly has normal keypad for input * These phones have medium display size and medium to high thickness * These are low to moderately priced phones targeted at the middle class segment |
Prices for AMOLED screens
Market data was collected for the prices of OLED screens by various manufacturers
| Company Name | Model Number | Size | Resolution | Colors | Price/unit(in USD) | ||
| 0-99 | 100-999 | 1000 ++ | |||||
| Chung Yuan Technology Co., Ltd | 2.2" | 220x176 | 20.00 | 16.5 | |||
| Digiprotek Markcom India P Ltd.(Densitron) | C0201QILK-C | 2 | 176xRGBx220 | 262K | 25.69 | 24.92 | 20.67 |
| C0240QGLA-T | 2.4 | 240xRGBx320 | 262K | 35.97 | 34.9 | 27.83 | |
| P0340WQLC-T | 3.45 | 480xRGBx272 | 16M | 85.65 | 83.1 | 47.72 | |
| P0430WQLC-T | 4.3 | 480xRGBx272 | 16M | 119.90 | 116.32 | 85.84 | |
| GLYN GmbH & Co. KG(CMEL) | C0201QILKC | 2 | 176x220 | 262K | 25.00 | 15 | |
| C0240QGLAT | 2.4 | 240xRGBx320 | 262K | 30.00 | 20 | ||
| C0283QGLDT | 2.83 | 240xRGBx320 | 262K | 38 | 26 | ||
| P0340WQLCT | 3.4 | 480xRGBx272 | 16M | 60.00 | 35 | ||
| P0430WQLCT | 4.3 | 480xRGBx272 | 16M | 90 | 63 | ||
| A4G Technologies(OSD) | OSD020AMQCIF | 2 | 176x220 | 262K | 22.50 | 20.98 | 19.10 |
| OSD024AMQV | 2.4 | 240x320 | 262K | 30.20 | 28.57 | 25.40 | |
| OSD0283AMQV | 2.83 | 240x320 | 262K | 38.30 | 36.16 | 33.63 | |
| OSD0340WQLC | 3.4 | 480x272 | 16M | 69.50 | 67.25 | 42.48 | |
| OSD0430WQLC-T | 4.3 | 480x272 | 16M | 109.00 | 87.00 | 72.00 | |
| Blaze Technology | BDO-0240QGLA-T | 2.4 | 240xRGBx320 | 262K | 20.8 | ||
| BDO-0283QGLD-T | 2.83 | 240xRGBx320 | 262K | 26.85 | |||
| BDO-0340WQLA-T | 3.4 | 480x272 | 16M | 39.5 | |||
| BDO-0430WQLA-T | 4.3 | 480x272 | 16M | 90.6 | |||
Like this report?
This is only a sample report with brief analysis
Dolcera can provide a comprehensive report customized to your needs
Bass Diffusion Analysis
One of the most important functions during the launch of a new product is to forecast the demand for that product, as it guides many other critical decisions faced by the company. Companies can schedule their production activities once they have an idea about the demand in the coming months or years. At a high level, Bass Diffusion Model is used to determine the shape of the curve representing the cumulative adoption of the new product. Bass describes the individuals who decide to adopt an innovation independently of the actions of others as innovators. Those who respond to the influences of the social system and obtain information about a new product from those who have already adopted the product are termed as imitators.
Proxies for analysis
The use of the model has been made by using the historical sales data of proxy products to forecast sales for OLED display mobile phones with an assumption that OLED display mobile phones would mimic the diffusion patterns of the proxies. Hence it was important to select the proxies carefully. We used the following for this forecast:
- iPhone - since this was the latest revolution in mobile phone devices and consumers would show a similar adoption behavior for a new mobile phone technology even though it comes at a price premium
- LCD/Plasma TVs & Monitors - consumers spent more money to purchase screens with superior quality by significantly increasing their budget
- LCD and Plasma TVs and LCD monitors were treated as a single analogous product(by ascribing different weights to these) for the forecast
Forecasting OLED display phone sales using Analogous Products
The following products from different product categories were considered:
- LCD TV
- Plasma Display TV
- LCD Monitor
They were considered to be befitting analogies because of the following similarities:
Weighted average for the analogous products:
Weights for modeling co-efficients for the analogous products such as LCD TV, Plasma Display TV and LCD monitor had been assigned.
To judge the similarity of analogous products to OLED, we examined two criteria.
- a. Market Structure
- b. Product Characteristics
- a. Market Structure
The S-Graph for the cumulative projected sale of OLED display mobiles modeled on analogous products
- In 2009 and 2010 OLED Mobile Phone market would grow slowly driven by innovators
- From 2011 to 2015, market will grow rapidly due to the early adopters
- In 2016 and 2017, market will growth will dwindle as late adopters take to the phones
- 2018 onwards growth will peter, as the laggards pick up the last few models and the market will saturate
- From 2016 the technology will near obsolescence and a new technology would replace it
Comparison of Adoption rate of Innovators with those of Imitators
The model helps to determine sales to innovators and imitators for each year:
This graph shows that a small number of innovators will kick-start the sales. OLED display mobile Phones will get off to a slow start in first 2 years. Once a critical mass is reached by the end of the second year, strong imitative effects will take over as the innovators decrease.
Detailed Analysis
The detailed modeling with a description of parameters and mathematical equations can be viewed here:
Bass Diffusion Analysis for OLED display phones
OLED Mobile Phone Projections Based on I-Phone
The S-Graph for the cumulative projected sale of OLED display mobiles modeled on analogous products
- From Q1,'09 to Q3,'09, the OLED display mobile phone market would grow slowly, driven by innovators
- From Q4,'09 to Q4,'10 market will grow rapidly due to the early adopters
- From Q1,'11 and Q3,'11 market growth will dwindle as late adopters take to the phones
- Q4,'11 onwards growth will peter, as the laggards pick up the last few models and the market will saturate
- From Q4, the technology will near obsolescence and a new technology would substitute it
Comparison of Adoption rate of Innovators with those of Imitators
The model helps to determine sales to innovators and imitators for each year:
This graph shows that a small number of innovators will kick-start the sales. OLED display mobile Phones will get off to a slow start in first three quarters. Once a critical mass is reached by the end of the Q3, strong imitative effects will take over as the innovators decrease.
Detailed Analysis
The detailed modeling with a description of parameters and mathematical equations can be viewed here:
Bass Diffusion Analysis for OLED display phones
Comparing projections
Since disparate product categories had been used for the two forecasts, the two were compared to cross validate the results <<excel sheet with calculations>>
- Looking at the forecast for OLED display mobile phones based on analogous products and on iPhone, both are seen to be convergent
- This validates the forecast
Sneak Preview of some models using OLED technology
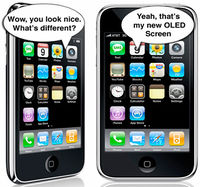
| 1. Apple iPhone - It’s nothing official at the moment, but word on the street is that Apple might have chosen a series of OLED displays for its next round of handsets. Such a move would certainly be in the best interests of battery life, as the iPhone isn’t noted for its battery capabilities. Considering the amount of new features that were announced in the iPhone 3.0 firmware update, it would be fairly practical to have a capacitive OLED display in the future. | |
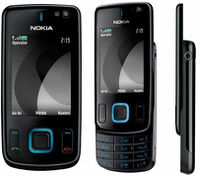
| 2. Nokia - Nokia 6600 Slide Mobile Phone is a 3G device with large OLED display and 3.2 megapixel camera. It has curved edges and with a weight of 110g is a bit heavy to hold. The 2.2” screen supports 16 million colors and comes with QVGA resolution. The dimensions of the phone are 90 x 45 x 14mm. | |
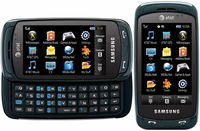
| 3. Samsung - Samsung A877 features include a 3.2-inch WQVGA AMOLED touchscreen, a 3 megapixel camera, GPS, HSDPA and Bluetooth. And as well at it supports AT&T’s 3G service. | |
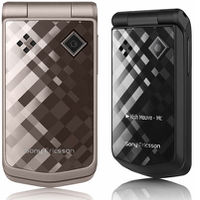
| 4. Sony - Sony Ericsson Z555 features a 1.9-inch LCD display, an OLED 128×36 external display, a 1.3 Megapixel camera with 4x digital zoom. | |
| 5. LG - One of the first handsets to get the new AM OLED, is already advanced LG SH150 DMB TV phone. | |
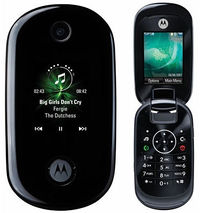
| 6. Motorola - The MOTO U9 is a Quad-band phone with a 2-inch QVGA LCD display, a 1.45-inch secondary OLED display, integrated music player, Bluetooth, 25MB internal memory and a microSD card slot. |
Like this report?
This is only a sample report with brief analysis
Dolcera can provide a comprehensive report customized to your needs
Contact Dolcera
| Samir Raiyani |
|---|
| Email: info@dolcera.com |
| Phone: +1-650-269-7952 |
