Difference between revisions of "Sports & Energy Drinks Market in Australia"
(→Sports & Energy Market Dashboard) |
(→Sports & Energy Market Dashboard) |
||
| Line 9: | Line 9: | ||
The following dashboard provides with a detailed Market Overview of the Sports & Drinks Market in Australia: | The following dashboard provides with a detailed Market Overview of the Sports & Drinks Market in Australia: | ||
{|align="center" | {|align="center" | ||
| − | |<gflash>750 600 http://dolcera.com/upload/files/ | + | |<gflash>750 600 http://dolcera.com/upload/files/Sports_Energy_Drinks_Market_Dashboard_01.swf</gflash> |
|- | |- | ||
|} | |} | ||
Revision as of 22:39, 14 May 2013
Contents
- 1 Research Objective
- 2 Sports & Energy Market Dashboard
- 2.1 Sports & Energy Drinks Market: Highlights
- 2.2 Sport & Energy Drinks - Market Trends
- 2.3 Sport & Energy Drinks - Market Prospects
- 2.4 Sports Drinks - Market Overview
- 2.5 Energy Drinks - Market Overview
- 2.6 Energy Drinks - Regulations
- 2.7 Australian Beverage Council
- 2.8 Energy Drink Consumption Behavior
- 2.9 Energy Drinks Distribution by Channel
- 3 Energy Drinks: Products Analysis
- 4 References
Research Objective
The Market Research on "Sports & Energy Drinks Market in Australia" was carried out with the following objectives:
- To provide with a detailed Market Analysis of Sports & Energy Drinks Market in Australia
- To identify the Major Products Globally in the Energy Drinks Market
- To provide with a detailed Product Analysis for Energy Drinks
- To provide with a focus on the Natural Energy Drinks Products in Australia
Sports & Energy Market Dashboard
The following dashboard provides with a detailed Market Overview of the Sports & Drinks Market in Australia:
Note:
- The values give in the dashboard for the period 2011-2015 are forecasts
- The Sports Drinks segment in Australia is majorly divided into Liquid/RTD (Ready to Drink) and Powder/tablets
- The Energy Drinks segment in Australia is majorly divided into Regular and Sugar-Free
Sports & Energy Drinks Market: Highlights
- Total volume sales for Sports & Energy Drinks increased by 11.9% in 2010 to reach 91.36 million litres
- Energy drinks drives overall growth via multipack sales across all major brands in 2011
- Energy drinks registers the highest total volume sales growth of 25.3% in 2010
- In 2010 the average current value unit price increases to A$6.83 per litre for energy drinks and A$2.78 per litre for sports drinks
- In 2011 manufacturers intensify their advertising and promotion of energy drinks to drive volume sales growth
- Sports and energy drinks is expected to post a 6% total volume sales CAGR over the forecast period
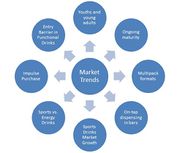
Sport & Energy Drinks - Market Trends
- Youths and young adults
- Youths and young adults are the key target consumers of energy drinks manufacturers as they constantly look for an instant ’pick me up’ and lead fast paced lifestyles
- These consumers are increasingly looking for products with greater efficacies to enable them to do more and sustain the intensity of their daily activities
- Manufacturers have been engaged in aggressive marketing so as to extend and expand the positive effects of this trend by using various platforms, such as extreme sports events, rock concerts and motor sport races
- Ongoing maturity
- Energy drinks recorded a 20% increase in total volume sales in 2011, compared to a 23% rise in 2010
- The slowdown in growth is due to ongoing maturity
- Multipack formats
- Multipack formats were the key initiatives undertaken by energy drinks manufacturers in 2011
- V, Monster, Mother and Red Bull have all focused on introducing multipacks to focus on volume sales and shares
- On-tap dispensing in bars
- Energy drinks manufacturers have introduced on-tap dispensing in bars and pubs across Australia
- This is aimed at growing the presence and awareness of these products in such venues
- This initiative has attracted much media attention as there was some opposition to the sale of caffeine drinks as alcoholic mixes, and a ban on the distribution of energy drinks on tap was proposed
- However, there is a lack medical evidence of its harmful effects
- Sports Drinks Market Growth
- Sports drinks recorded good sales growth of 3% in 2011 due to significant new launches and innovation
- Off-trade volume sales increased by 3% in 2011, while off-trade current value sales rose by 5
- Functional claims, which are key to sales growth in sports drinks, are becoming more specific and segmented
- Brands play an important role in sports drinks as their efficacy claims are perceived to be more credible
- This complements the appeal to consumers who are looking for specific benefits, for example hydration pre-workout (sustenance) or post-workout (rehydrate)
- Sports vs. Energy Drinks
- Sports drinks enjoys a broader consumer base in Australia than energy drinks
- The demand for energy drinks is very much confined to teenagers and young adults
- Sports drinks, whilst targeted at sports-orientated and active people, enjoys a broader base because of the inherent thirst-quenching properties of such products
- Impulse Purchase
- Consumers typically purchase energy drinks on impulse during late afternoons and evenings
- Hence convenience stores is an important channel for the sale of energy drinks in Australia
- Marketers invest in strong point-of-sale merchandising to win convenience and impulse sales
- Coca-Cola Amatil has invested heavily in various point-of-sale materials for each of its many formats, especially in support of its new Powerade Fuel+ launch
- Entry Barrier in Functional Drinks
- Private label had not been introduced in functional drinks in Australia by the end of the review period
- Entry barriers remain high due as product efficacy is the key attribute of functional drinks and consumers demand brands which perform as claimed
- Branding, product claims and sports sponsorship are key elements needed to succeed in functional drinks
Sport & Energy Drinks - Market Prospects
- As the lifestyles of Australian consumers become more hectic, the demand for beverages which provide rapid energy boosts and effective sustenance will increase
- Energy drinks is set to remain the most convenient and readily available answer to these demands
- In Australia, energy drinks is set to record strong volume and value sales growth over the forecast period as manufacturers invest in marketing, product and pack size innovation and flavor enhancement
- The growth in sports drinks is expected to be slower as it is a more mature type than energy drinks
- In addition, numerous substitutes are available to consumers of sports drinks, such as functional bottled water, fruit/vegetable juice and RTD tea
- Two key threats to forecast growth in energy drinks are: the introduction of private label products; and the association of significant adverse health effects with the excessive consumption of energy drinks, by a credible health authority
- As for sports drinks, a potential threat to growth lies in the introduction of drinks with higher benefits in adjacent categories like concentrates
- Entry barriers will remain high for private label sports and energy drinks in the near future. The technology behind the manufacture of these products and the equity of leading brands create strong barriers for retailers to penetrate
Sports Drinks - Market Overview
Sports Drinks – Market Volume
- The Sports Drinks (Australia) market by volume increased by 4.6% in 2010
- Total volume for Sports Drinks (Australia) in 2010 was 55.16 m litres
- The strongest growth in recent years for Sports Drinks (Australia) was in 2006, with a rate of 35.8%
- Compound annual growth rate for Sports Drinks (Australia) for the period 2006-2010 was 8.3%.
- In 2015 the Sports Drinks (Australia) market is forecast to reach 72.39 m litres representing a volume CAGR of 5.3% since 2011
Sports Drinks – Market Value
- The Sports Drinks (Australia) market by value increased by 12.9% in 2010
- Total value for Sports Drinks (Australia) in 2010 was 153.5 m AUD
- The strongest growth in recent years for Sports Drinks (Australia) was in 2006, with a rate of 28.6%.
- Compound annual growth rate for Sports Drinks (Australia) for the period 2006-2010 was 13.3%
- In 2015 the Sports Drinks (Australia) market is forecast to reach 225.1 m AUD representing a value CAGR of 8.0% since 2011
Energy Drinks - Market Overview
Energy Drinks – Market Volume
- The Energy Drinks (Australia) market by volume increased by 25.2% in 2010
- Total volume for Energy Drinks (Australia) in 2010 was 36.20 m litres
- The strongest growth in recent years for Energy Drinks (Australia) was in 2007, with a rate of 49.5%
- Compound annual growth rate for Energy Drinks (Australia) for the period 2006-2010 was 39.0%
- In 2015 the Energy Drinks (Australia) market is forecast to reach 56.90 m litres representing a volume CAGR of 10.1% since 2011
Energy Drinks – Market Value
- The Energy Drinks (Australia) market by value increased by 19.8% in 2010
- Total value for Energy Drinks (Australia) in 2010 was 247.3 m AUD
- The strongest growth in recent years for Energy Drinks (Australia) was in 2007, with a rate of 55.1%
- Compound annual growth rate for Energy Drinks (Australia) for the period 2006-2010 was 34.7%
- In 2015 the Energy Drinks (Australia) market is forecast to reach 439.0 m AUD representing a value CAGR of 12.5% since 2011
Energy Drinks - Regulations
- Energy drinks in Australia are one of the most stringently regulated categories of all the world markets
- Energy drinks are classified as a food and as such are regulated under the Australia and New Zealand Food Standards Code under Standard 2.6.4 Formulated Caffeinated Beverages (FCBs).
- FCBs are non-alcoholic beverages which must contain certain levels of caffeine and this range is between 145mg/L and 320mg/L
- This is comparable to the caffeine levels found in coffee which typically vary from 60-120mg per cup of coffee (approx 240mg-480mg/L)
- Energy drinks must comply with labelling provisions of the Code with regards to contents disclosure, recommended daily usage and advisory statements that the product is not suitable for children, pregnant or lactating women. This is in addition to compliance with the relevant sections of the Competition and Consumer Act (2010)
- These Australian regulations compare to the USA and Europe where there are no limits to the levels of caffeine that can be added to beverages. US regulation does not require any specific labeling of energy drinks and European Union legislation stipulates that products containing more than 150mg/L of caffeine must bear the advisory statement ’high caffeine content’ followed by the amount of caffeine contained in mg/100mL
Australian Beverage Council
The Australian Beverages Council represents over 95% of the non-alcoholic beverage industry in Australia comprising large, medium and small members from across the country. Members of the Beverages Council that manufacture or distribute energy drinks¸ representing 99% of the market’s production volume have all committed to a range of best practice standards over and above legislative requirements. As energy drinks are developed for a mature consumer, all members commit to the following guidelines which relate to the manufacture, distribution and marketing of energy drinks:
- Energy drinks are not made available in primary nor secondary schools
- Marketing and advertising activities of energy drinks are not directed at children
- No promotional activities are undertaken that encourage excessive consumption of energy drinks
- Labels of energy drinks do not promote the mixing of energy drinks with any other beverage
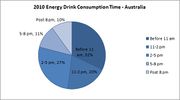
Energy Drink Consumption Behavior
- 32% of energy drinks are consumed in the morning, before 11 am
- 90% of energy drinks are consumed before 8pm
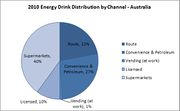
Energy Drinks Distribution by Channel
- 9 out of 10 energy drinks are sold away from licensed venues
- Almost half of all energy drink sales occur in the supermarket
- Petrol Station and Convenience contribute 27% to the total sales
- But Licensed Venues contribute only 10% to Energy Drink Sales
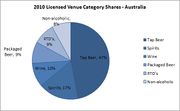
- Non-alcoholic drinks represent 8% of total licensed premise revenue
- Of the non-alcoholic sales, only 8% are energy drinks
- Consequently only 0.64% of total venue sales are energy drinks of which only a proportion are mixed with alcohol
Energy Drinks: Products Analysis
Energy Drinks: Global Products Comparison
The following dashboard illustrates the Product Comparison of all the major Energy Drinks Products present globally:
Natural Energy Drinks in Australia: Products Description
The following dashboard illustrates the Product Description of Natural Energy Drinks Products present in Australia:
Note: The above dashboard is not exhaustive in terms of number of products.
References
- Sports and Energy Drinks in Australia - Euromonitor International
- Sports Drinks in Australia (2011) - Mintel Global Market Navigator
- Energy Drinks in Australia (2011) - Mintel Global Market Navigator
- Findthebest.com
- Datamonitor
- Just Drinks
- Company Websites
- Trade Journals
- Industry Associations
- News Articles
- Other Relevant Sources


